
SDG Goals
Goal 1: End poverty in all its forms everywhere
Giving people in all parts of the world the support they need to lift themselves out of poverty in all its manifestations is the very essence of sustainable development. Goal 1 focuses on ending poverty through interrelated strategies, including the promotion of social protection systems, decent employment and the resilience of the poor. Although the global rate of extreme poverty has been reduced by more than half since 2000, intensified efforts are required to boost the incomes, alleviate the suffering and build the resilience of those still impoverished, particularly in sub-Saharan Africa. Social protection systems need to be expanded and risks mitigated for disaster-prone countries, which tend to be among the world’s poorest countries.
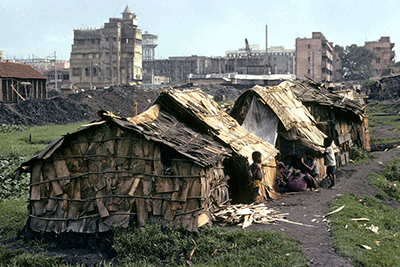
Photo Credit : © The World Bank/Dominic Chavez
Nearly a billion people have escaped extreme poverty since 1999; three quarters of a billion remain in its grasp
The international poverty line is currently defined as 1.90 US dollars per person per day using 2011 purchasing power parity (PPP). In 2013, an estimated 767 million people lived under the poverty line, down from 1.7 billion people in 1999. This represents a reduction in the global extreme poverty rate from 28 per cent in 1999 to 11 per cent in 2013. The fastest progress was observed in Eastern and South-Eastern Asia, where 3 per cent of the population lived in extreme poverty in 2013, down from 35 per cent in 1999. Despite a decline in the poverty rate in sub-Saharan Africa, 42 per cent of the population continued to subsist in conditions of extreme poverty in 2013. In fact, sub-Saharan Africa was home to about half of the world’s poor. Combined with Southern Asia, the two regions accounted for over 80 per cent of the world’s poorest people that year.
Working poverty has decreased, but it is still pervasive in many regions and disproportionately affects the young
Many of the world’s workers live in extreme poverty due to a lack of decent work opportunities. Almost 10 per cent of the employed population globally lived with their families on less than 1.90 US dollars per person per day in 2016. While the percentage of the “working poor” has been cut by more than half since 2000—when it stood at 28 per cent—it remains pervasive in a few regions. In sub-Saharan Africa, 34 per cent of workers and their families continued to live in extreme poverty in 2016. Working poverty affects youth at a much higher rate than adults: in 2016, 15 per cent of young workers worldwide lived under the international poverty line, compared to 9 per cent of adult workers. This pattern holds true across almost all regions.
Proportion of employed population living below 1.90 US dollars a day, youth and adults, 2000 and 2016 (percentage)

Note: Adults refer to persons aged 25 and above, youth refers to persons aged 15 to 24.
Less than half the world’s population is covered by at least one social protection scheme
Social protection systems have an important role in protecting the most vulnerable. They are fundamental to preventing and reducing poverty and inequality at every stage of people’s lives. Benefits for children, mothers with newborns, persons with disability, older persons and those who are poor and without jobs help ensure that no one is left behind. Preliminary data show that in 2016, only 45 per cent of the world’s population were covered by at least one social protection cash benefit, and that the proportion varied widely across countries and regions. Sub-Saharan Africa has the lowest coverage, with about 13 per cent of its population covered by at least one social protection benefit, versus 86 per cent of the population in Europe and Northern America.
Social protection coverage varies widely by type of benefit, with many vulnerable groups left behind
In 2016, 68 per cent of people above retirement age received a pension. However, this global average masks large regional differences. In sub-Saharan Africa, only 22 per cent of people above retirement age received a pension in 2016, while in Europe and North America, pension coverage is almost universal. Other vulnerable groups also lack social protection. In 2016, only 22 per cent of the unemployed worldwide received unemployment benefits, 28 per cent of people with severe disabilities collected a disability pension, 35 per cent of children were covered by social protection, and 41 per cent of women giving birth received maternity benefits.
Probabilistic models show that small island developing States are expected to bear disproportionately large economic losses attributed to disasters
Building the resilience of the poor and strengthening disaster risk reduction are key strategies for ending extreme poverty in the most afflicted countries. Economic losses from natural hazards are now reaching an average of 250 to 300 billion US dollars a year. Based on the estimated future loss—as measured by Average Annual Loss (AAL)—the largest losses will be concentrated in bigger economies. However, smaller and more vulnerable countries, particularly the small island developing States, bear a disproportionate impact in relation to the size of their economies. More efforts should be made to promote disaster risk reduction, particularly in these most vulnerable countries.
Proportion of the population living below 1.90 US dollars a day, 1999 and 2013 (percentage)