
SDG Goals
Goal 12: Ensure sustainable consumption and production patterns
Consumption and production patterns shape resource use management and related social and environmental impacts, thereby affecting sustainability. Sustainable production uses fewer resources for the same value of economic output, and sustainable consumption reduces the need for excessive resource extraction. Over the first decade of this century, however, the material footprint, which measures the amount of raw material extracted to meet consumption demand, increased globally, as did the amount of material used in production processes. Achieving this Goal requires strong national frameworks for sustainable consumption and production that are integrated into national and sectoral plans, along with sustainable business practices and consumer behaviour. Finally, it requires adherence to international norms related to hazardous chemicals and wastes.
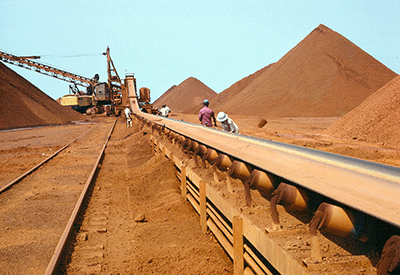
Photo Credit : © UN Photo/B Wolff
The material footprint of a person in developed regions is considerably higher than that of a person in developing regions
The term "material footprint" refers to the amount of raw materials extracted globally that are used to meet the domestic final consumption demand of a country. It highlights the volume of primary materials required across the entire supply chain—domestic and foreign—to meet consumption needs. Globally, the material footprint rose from 48.5 billion metric tons in 2000 to 69.3 billion metric tons in 2010. Two regions accounted for the largest share of this footprint: Eastern and South-Eastern Asia (28.6 billion metric tons) and Europe and Northern America (21.9 billion metric tons).
In per capita terms, the global material footprint increased as well—from 8 metric tons per capita in 2000 to 10.1 metric tons per capita in 2010. The material footprint per capita increased in almost all regions, meaning that the world now needs more raw materials to satisfy the consumption needs of an individual.
In 2010, Australia and New Zealand had the highest material footprint per capita (34.7 metric tons per person), while sub-Saharan Africa had the lowest (2.5 metric tons per person). The material footprint per capita of developed regions far exceeds that of the developing regions. In other words, much of the raw material extracted globally goes to serve the consumption needs and habits of individuals in developed regions.
Material footprint, 2000 and 2010 (billion metric tons)
Most regions have managed to use fewer resources per unit of production
Domestic material consumption (DMC) refers to the amount of material used in production processes within an economy. DMC per unit of GDP is the amount of resources required to produce a unit of output. From 2000 to 2010, DMC per GDP decreased in all regions except Eastern and South-Eastern Asia, and Northern Africa and Western Asia. In Eastern and South-Eastern Asia, DMC per unit of GDP increased from 2.0 to 2.7 kilograms over that period. This is mainly due to the global shift in manufacturing to this region and the rapid industrialization that followed. As a result, DMC per unit of GDP increased globally from 1.2 kilograms to 1.3 kilograms. Total DMC also rose over this period, from 48.7 billion metric tons to 71 billion metric tons; Eastern and South-Eastern Asia accounted for 42 per cent of all materials consumed in 2010.
Domestic material consumption per unit of GDP, 2000 and 2010 (kilogram per unit of GDP)
Many countries still fail to fully meet their reporting commitments under key global environmental agreements on chemical and hazardous waste
Countries continue to address air, soil and water pollution, and exposure to toxic chemicals, under the auspices of various multilateral agreements. These include the Montreal Protocol on Substances that Deplete the Ozone Layer, the Basel Convention on the Control of Transboundary Movements of Hazardous Wastes and their Disposal, the Rotterdam Convention on the Prior Informed Consent Procedure for Certain Hazardous Chemicals and Pesticides in International Trade, and the Stockholm Convention on Persistent Organic Pollutants. Furthermore, the new Minamata Convention on Mercury will enter into force on 16 August 2017. Almost all United Nations Member States are party to at least one of these conventions and 157 of them are party to three. Under the current conventions’ obligations, countries are requested to regularly report data and information related to hazardous wastes, persistent organic pollutants and ozone-depleting substances. However, between 2010 and 2014, only 51 per cent of Parties to the Stockholm Convention, 57 per cent of Parties to the Basel Convention, and 71 per cent of Parties to the Rotterdam Convention provided the requested data and information. All Parties reported to the Montreal Protocol.