SDG Goals

Ensure sustainable consumption and production patterns
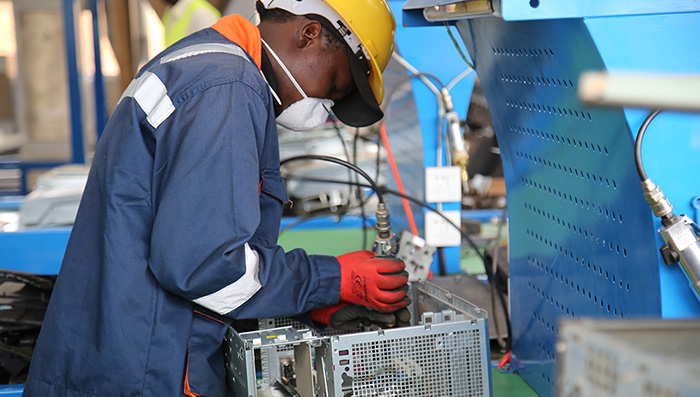
An employee dismantles electronic equipment at a facility established in conjunction with Rwanda’s national e-waste management and recycling strategy. The construction of the facility and implementation of the strategy was made possible through an investment by the Rwanda Green Fund.
© Rwanda Green FundA growing global population combined with the unsustainable use of natural resources is having a devastating impact on our planet – propelling climate change, destroying nature and raising pollution levels. About 14 per cent of the world’s food is lost along the supply chain prior to the retail level. Around the world, 1 million plastic drinking bottles are purchased every minute, and 5 trillion single-use plastic bags are thrown away each year. The global material footprint increased by 70 per cent between 2000 and 2017.
Today, we have a historic window of opportunity to design a transformative COVID‑19 recovery strategy to build sustainable and resilient economies and societies. It is time to fully embrace the decoupling of economic growth from environmental degradation, a reduction in carbon emissions, improvements in resource efficiency, and the promotion of sustainable lifestyles.
The rapidly growing rate of natural resource consumption is unsustainable
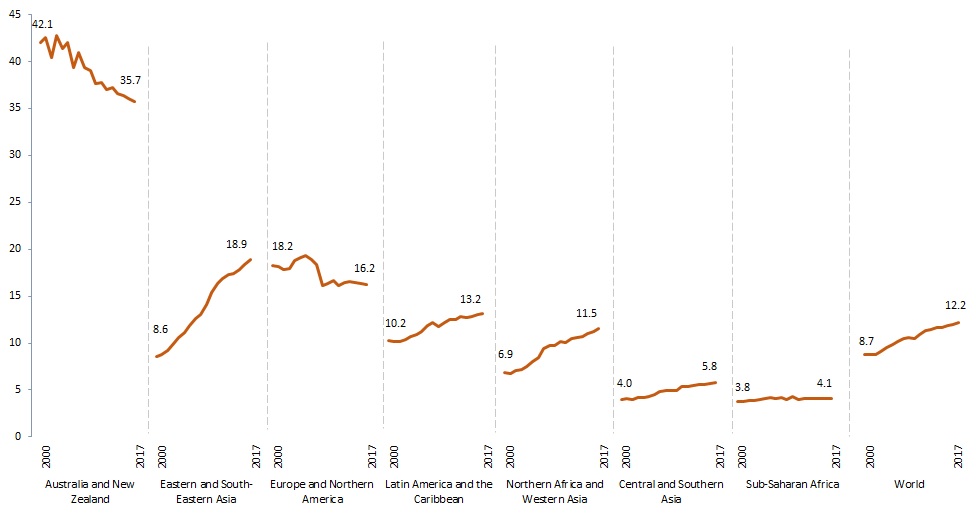
Globally, domestic material consumption per capita, the total amount of materials directly used by an economy to meet its consumption needs, rose by more than 40 per cent from 2000 to 2017 – from 8.7 to 12.2 metric tons. All regions except Europe and Northern America and Australia and New Zealand experienced significant increases over the past two decades. Rising domestic material consumption in developing regions is mainly due to industrialization, including the outsourcing of material-intensive production from developed regions. Natural resource use and related benefits, along with environmental impacts, are unevenly distributed across countries and regions. A path for sustainable consumption and production requires circular economy approaches, designed to reduce or eliminate waste and pollution, keep products and materials in use, and regenerate natural systems.
Domestic material consumption per capita, 2000 to 2017 (metric tons per capita)
Progress to promote sustainable production and consumption is uneven
Shifting to sustainable consumption and production patterns is a prerequisite to addressing global crises, including climate change, biodiversity loss and pollution, and is central to achieving sustainable development. There is a positive trend in the development of national instruments and strategies aimed at supporting this shift. By 2020, 83 countries and the European Union reported a total of 700 policies and implementation activities under the 10-Year Framework of Programmes on Sustainable Consumption and Production. However, only 50 policies and implementation activities were reported in sub-Saharan Africa, compared with 374 in Europe and Northern America.
As of December 2020, 40 countries had reported on sustainable public procurement policies or action plans (or equivalent legal dispositions), which encourage the procurement of environmentally sound, energy-efficient products, and promote more socially responsible purchasing practices and sustainable supply chains.
Countries reporting on national action plans or policies on sustainable consumption and production, 2017–2019 reporting cycle and 2020 reporting cycle
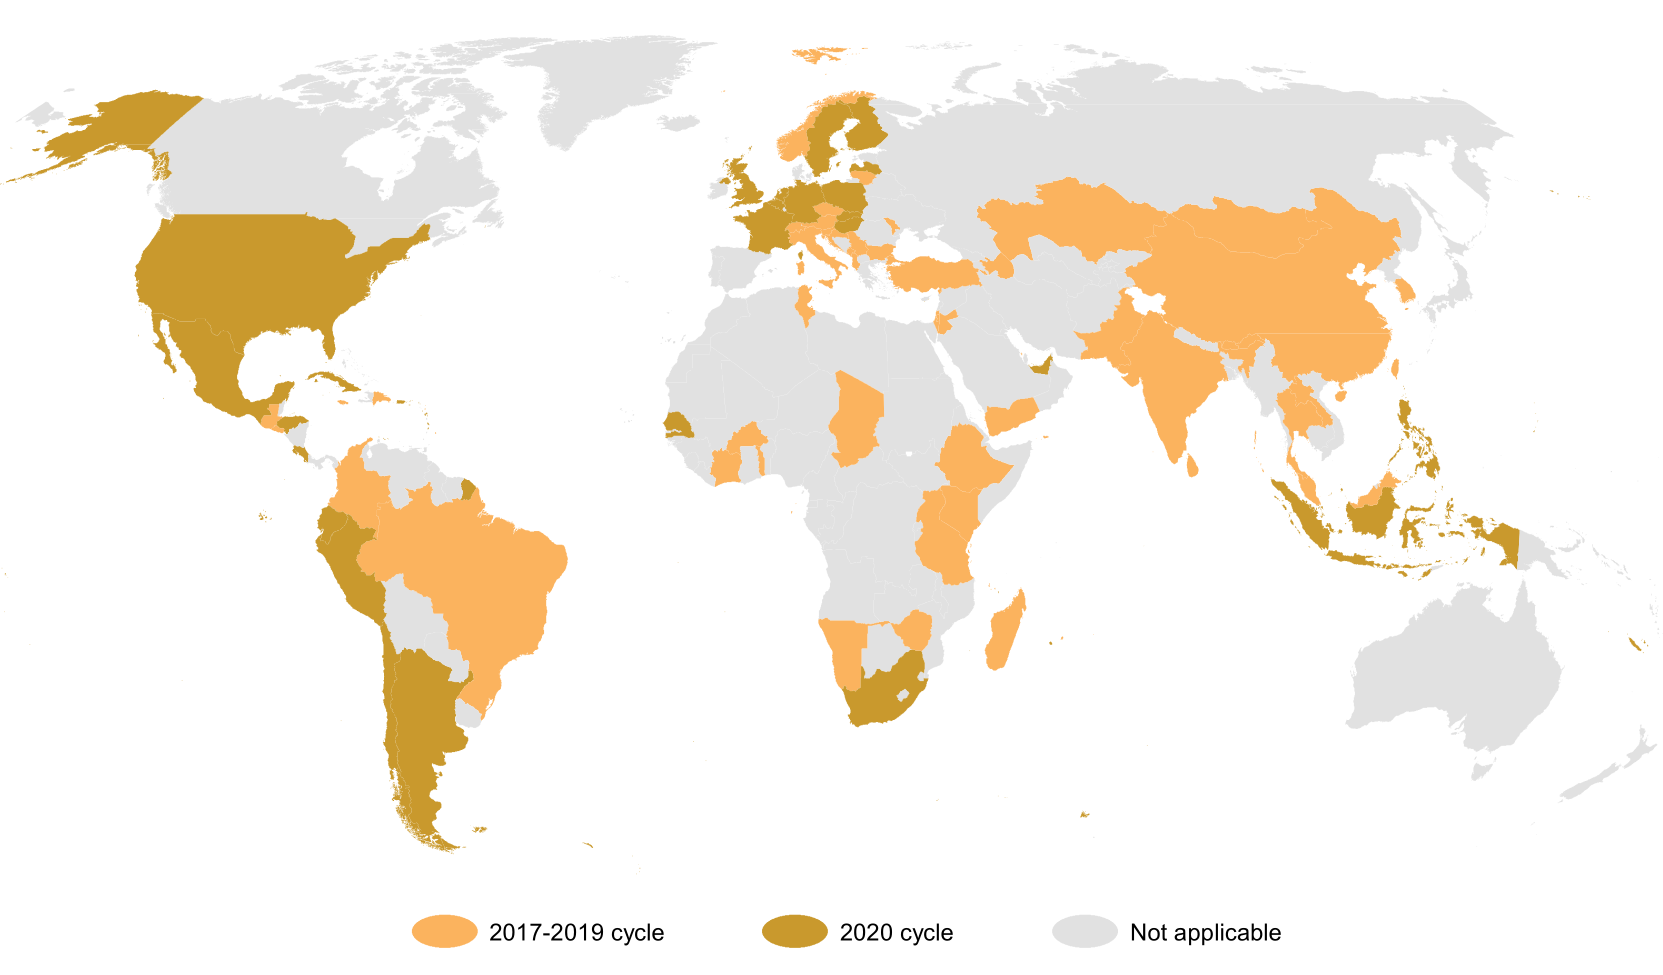
Note: The boundaries and names shown and the designations used on this map do not imply official endorsement or acceptance by the United Nations.
Electronic waste continues to proliferate and is not being disposed of in a responsible way
In 2019, the world generated 53.6 million metric tons of electronic and electrical equipment waste (e-waste), an increase of more than 20 per cent since 2014. Each person generated about 7.3 kilograms of e-waste in 2019, of which only 1.7 kilograms was documented to have been managed in an environmentally sustainable way. Improper disposal of e-waste causes poisonous chemicals to be released into the soil and water, putting environmental and human health at risk. It results in a significant loss of scarce and valuable raw materials, such as gold, platinum, cobalt and rare earth elements. As much as 7 per cent of the world’s gold may currently be contained in e-waste.
E-waste generation is expected to grow by 0.16 kilograms per capita annually, reaching 9.0 kilograms per capita in 2030 (or 74.4 million metric tons in total). However, the realized annual growth rate of e-waste recycling in the past decade was only 0.05 kilograms per capita. It will need to be at least 10 times higher to ensure recycling of all e-waste by 2030.
E-waste generated and recycled, 2010–2019, projected e-waste generated and required growth in recycling, 2020–2030 (kilograms per capita)

Progress to eliminate fossil fuel subsidies remains uneven, threatening the achievement of the Paris Agreement and 2030 Agenda
Fossil fuel subsidies from Governments provide incentives to produce and consume fossil fuels, such as coal, crude oil and natural gas, over the development and use of clean and renewable energy. They contribute to the climate crisis and air pollution, and negatively impact public health. Fossil fuel subsidies saw a decline in 2019 to $432 billion due to lower fuel prices, breaking an upward trend from 2017 ($450 billion) and 2018 ($548 billion). Subsidies were expected to decline sharply in 2020 due to cratering demand and the oil price shock. That drop in fossil fuel subsidies (measured as a proportion of GDP) is likely to be smaller than expected, however, due to a simultaneous decrease in GDP worldwide in 2020. With lower fuel prices over the last two years, many countries took the opportunity to press for reforms and phase out subsidies. However, progress remains uneven. With fuel prices rising sharply in 2021, there is also a danger of regressing and failing to meet the commitments made in the 2030 Agenda for Sustainable Development and the Paris Agreement.
Fossil fuel subsidies as a proportion of GDP, 2015 and 2019 (percentage)
*Excluding Australia and New Zealand.
Despite progress, developing countries still have vast untapped potential for renewable energy
Globally, new-renewable electricity capacity installations witnessed remarkable development over the past decade, outpacing installations in nonrenewable electricity capacity since 2012 and consistently since 2015. In 2018, for the first time, the majority of new renewable electricity capacity was installed in developing countries. The significant increase in capacity in these countries can be attributed primarily to the uptake of new solar and wind capacity, which increased by a compound annual growth rate of 72 per cent and 22 per cent, respectively, from 2010 to 2019. The most recent data show that renewable energy capacity continued to grow at an even higher level in 2020, despite COVID-19.
In 2019, developing countries had 219 watts per capita of renewable energy capacity. However, renewable energy capacity was 880 watts per capita in developed countries, four times higher than that of developing countries, suggesting there is still room for growth.