SDG Goals

Reduce inequality within and among countries
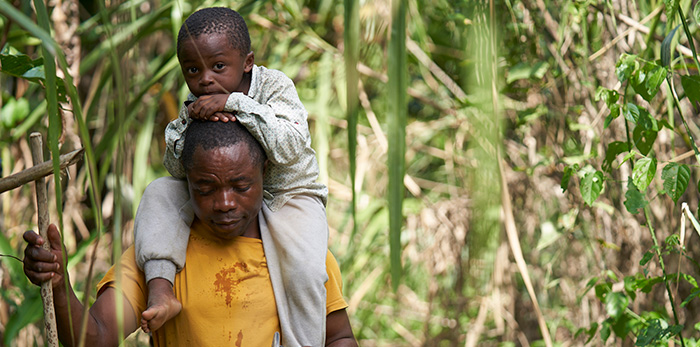
A family from Africa cross the Darién Gap, a jungled portion of land straddling the border between Colombia and Panama. Migrants describe the Darien Gap as the most dangerous and difficult stage of their journey to North America.
© UNICEF/William UrdanetaBefore the COVID-19 pandemic, various measures of inequality were moving in the right direction. Income inequality had fallen in some countries. Low-income countries continued to benefit from preferential trade status. The transaction costs of remittances were going down. Most countries with available data had policies that facilitated orderly, safe and responsible migration. However, inequality persists, whether in income, wealth, opportunities or other dimensions. Those considered vulnerable also face multiple and intersecting forms of discrimination. The pandemic is exacerbating existing inequalities within and among countries and hitting the most vulnerable people and the poorest countries hardest. Tackling inequality will be crucial for reducing vulnerability to health and other emergencies and for enhancing the resilience of societies.
The proportion of the global population who are refugees has more than doubled since 2010
By mid-2020, the number of people who had fled their countries and become refugees due to war, conflict, persecution, human rights violations and events seriously disturbing public order had grown to 24 million, the highest absolute number on record. For every 100,000 persons, 307 are refugees outside their country of origin, more than double from 2010.
Among people originating from Northern Africa and Western Asia, the share of refugees increased from 579 to1,523 per 100,000 between 2010 and 2020. The Syrian Arab Republic has been the main country of origin for refugees since 2014. The share of people from Latin America and the Caribbean who fled across international borders and received international protection increased from 80 to 620 out of 100,000 over the same period. The COVID-19 pandemic has proved particularly challenging for refugees. At the peak of the first wave in April 2020, 168 countries had fully or partially closed their borders, of which around 90 made no exceptions for people seeking asylum, increasing the vulnerability of these populations.
Despite thousands of migrant deaths each year, not all countries have comprehensive policies on migration
Even with mobility restrictions on borders around the world due to COVID-19, tens of thousands of people continue to leave their homes and embark on dangerous journeys across deserts and seas. In 2020, 4,186 deaths and disappearances were recorded on migratory routes worldwide. Though this is fewer than in previous years, some routes saw an increase in fatalities. Most notably, at least 849 people died en route to the Canary Islands in 2020, compared with 210 recorded in 2019 and 45 in 2018. The true number of deaths globally may be higher, as the pandemic has increased the challenges to collecting this data. The latest figures show that, as of 2019, just 54 per cent of countries had a comprehensive set of policy measures to facilitate orderly, safe, regular and responsible migration and mobility of people, based on the 111 countries with available data.
Income inequality has been going down since the 2008 global financial crisis; the pandemic could reverse that trend
The Gini index is one of the most commonly used measures of income inequality. It ranges between 0 and 100, where 0 indicates that income is shared equally among all people, and 100 indicates the extreme situation where one person accounts for all income. Prior to COVID-19, the average Gini index for emerging market and developing countries had been falling. However, the World Economic Outlook, October 2020 of the International Monetary Fund estimates that COVID-19 will increase the average Gini index for these countries by 2.6 points to 42.7 (a 6 per cent increase). This will reverse the fall in inequality since the global financial crisis in 2008. For low-income countries, the impact is projected to be even larger, despite the fact that those countries made less progress in reducing inequality since 2008.
Fiscal policies that help shape more equitable societies play a small role in low-income countries
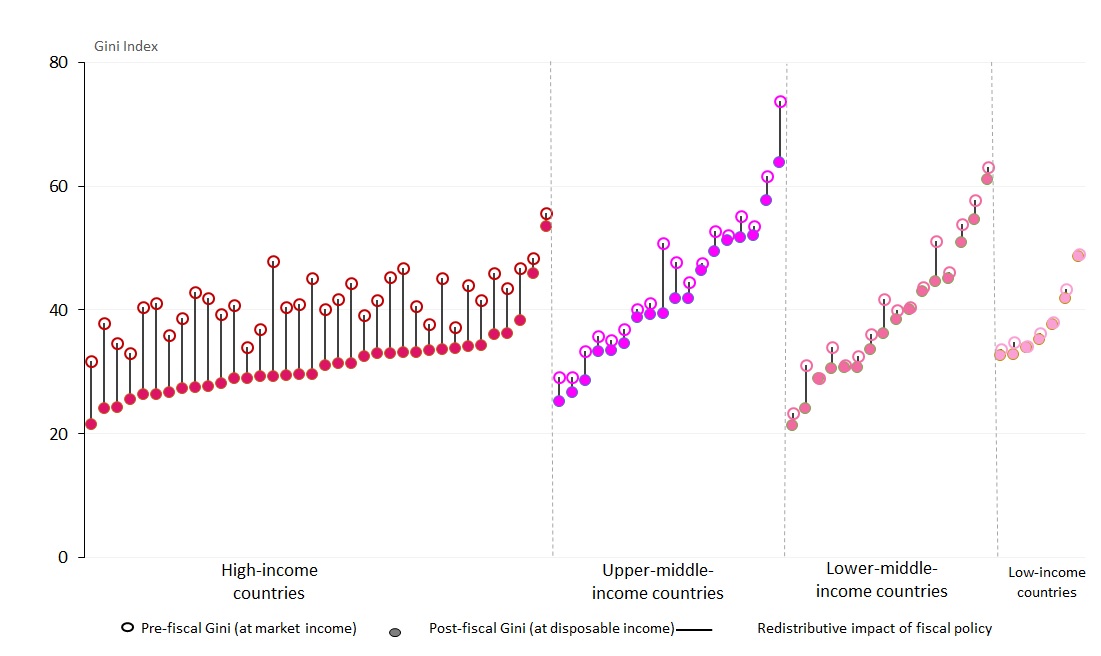
Some of the most effective mechanisms Governments have for reducing economic inequalities are taxes, and cash and in-kind transfers. The difference in the Gini index before and after taxes and social transfers provides a measure of how effective these policies are at redistributing incomes and lowering inequality. As countries struggle to recover from the COVID-19 crisis, the distributional impacts of such fiscal policy responses are becoming even more important.
Data for 77 countries between 2013 and 2018 show substantial differences across countries in the effects direct taxes and cash transfers have in reducing inequality. Overall, the impacts are largest in high-income countries, with an average reduction in the Gini index of 10 percentage points, compared with just 1 percentage point among the low-income countries. This greater redistribution is partly explained by a much larger personal tax base in high-income countries, which reduces inequality directly through richer individuals paying a larger proportion of their income in taxes, as well as supporting social protection programmes.
Redistributive impact of direct taxes and cash and near-cash transfers, around 2017
Relative low incomes mean that many are being left behind
Measuring the share of the population living below 50 per cent of the national median income is useful for monitoring the level and trends in social inclusion, relative poverty and inequality within a country. If the median grows over time, while the share of the population living below 50 per cent of the median increases, this means the poorest are falling behind in relative terms. The latest estimates show that in some countries, as much as 25 per cent of the population live on less than half the median income. On average, 13 per cent of people experience relative low income across the 104 countries with available data, although considerable differences are observed among regions. In countries in Latin America and the Caribbean, almost one in five people live on less than half their national median income, on average, although some progress has been made in many countries since 2010. Around 9 per cent of people live on less than half the national median in countries in Central and Southern Asia, the lowest level among all regions.
Proportion of the population living below 50 per cent of the national median income, around 2017 (percentage)
Note: Figure is based on unweighted averages across countries with available data within each region. Differences in levels need to be interpreted with caution, due to a mix of income and consumption surveys used across countries.
Remittance costs are at an all-time low, but more effort is still needed to meet the agreed target
Over the past decade, significant progress has been made in reducing the transaction cost of remittances. The global average cost of sending $200 was 9.3 per cent in 2011. Despite the pandemic, the cost of sending money reached a record low of 6.5 per cent in the final quarter of 2020. That year, it was most expensive to send money to Oceania (excluding Australia and New Zealand) and sub-Saharan Africa – with costs of 9.1 per cent and 8.5 per cent, respectively – although substantial progress has been made in both regions since 2011. Regional remittance costs have declined overall since 2011, but only Central and Southern Asia has fallen below the targeted 5 per cent threshold so far. Coordinated efforts by public authorities, service providers and non-governmental organizations remain necessary to achieve the target of a global average cost of 3 per cent, along with costs to senders for all regions of 5 per cent or less, by 2030.
Proportion of the population who are refugees, by region of origin, 2010 and 2020 (per 100,000 population in the country of origin)