SDG Goals

Reduce inequality within and among countries
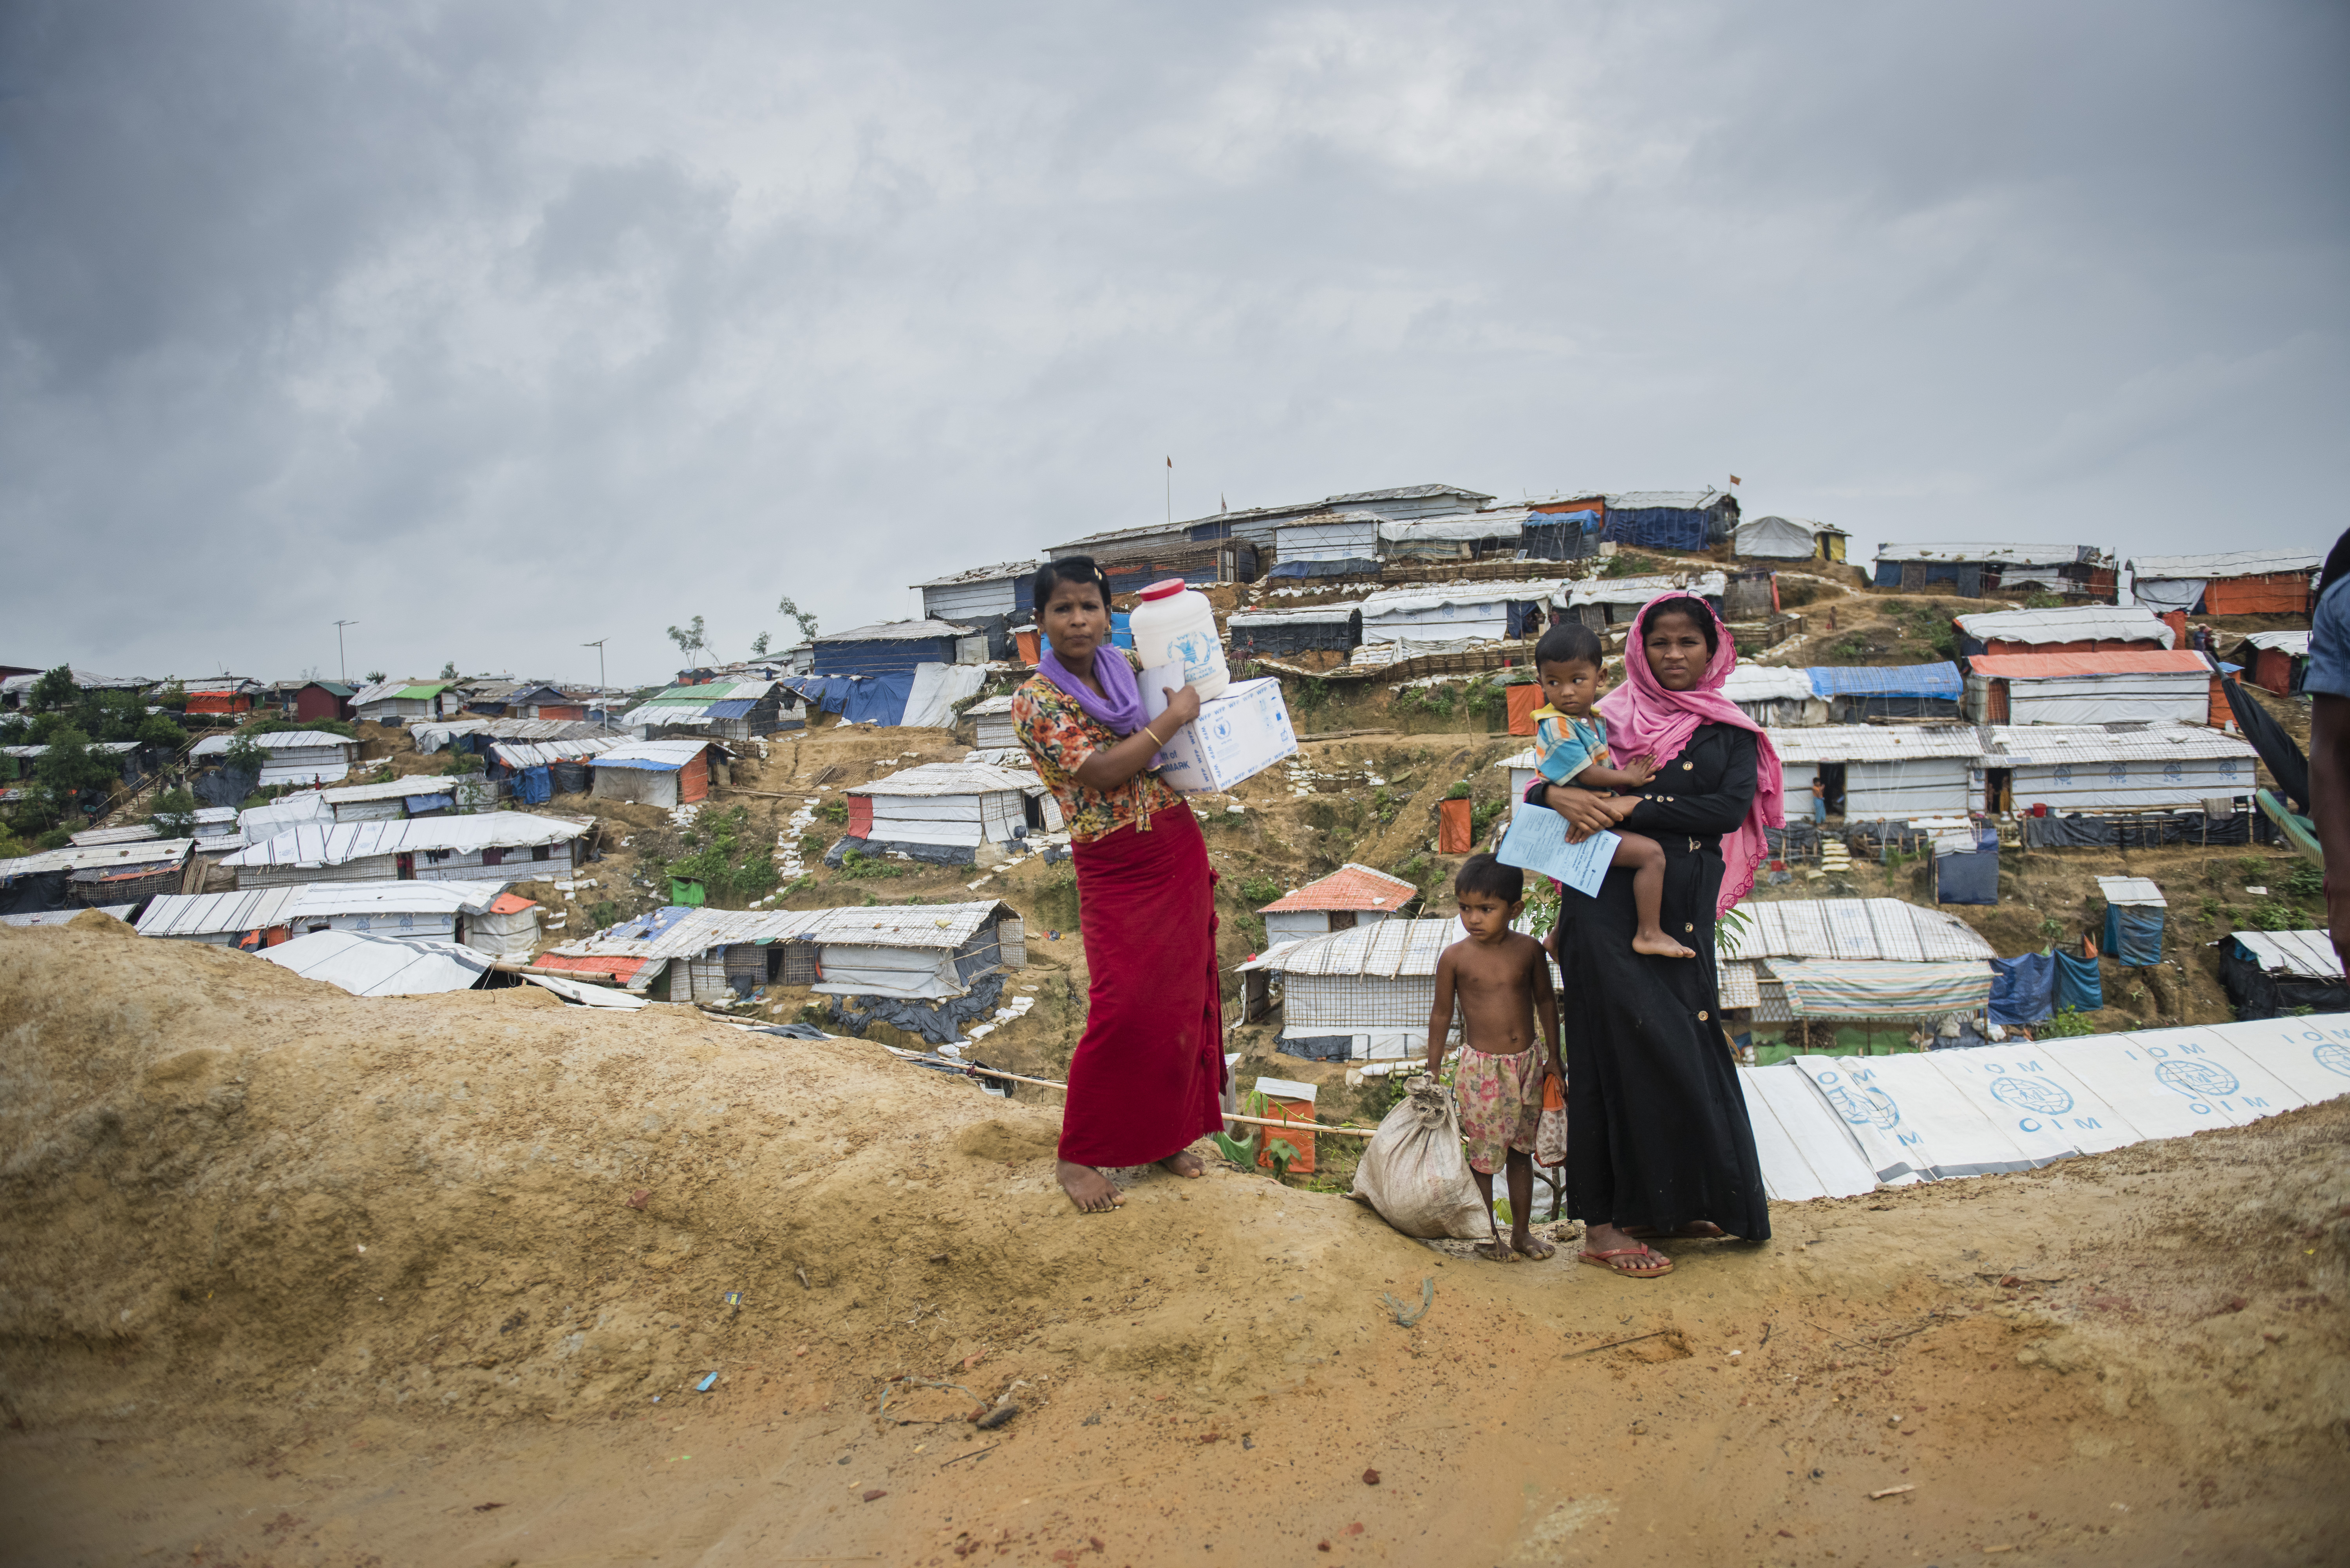
Despite some positive signs – such as lower income inequality in some countries and preferential trade status for lower-income countries – inequality in its various forms persists. The COVID-19 crisis is making inequality worse. It is hitting the most vulnerable people hardest, and those same groups are often experiencing increased discrimination. The wider effects of the pandemic will likely have a particularly damaging impact on the poorest countries. If a global recession leads to reduced flows of development resources, that impact will be even more severe.
While real incomes of the poorest within countries are rising, the rich still prosper disproportionately
Leaving no one behind means that those with lower incomes are able to benefit and participate in a country’s broader economic growth. Progress towards shared prosperity can be measured through the growth of household income (or consumption) of the poorest 40 per cent of a country’s population. In 73 of the 90 countries with comparable data during the period 2012 to 2017, this group experienced real income growth. Furthermore, in more than half of those countries (49), the bottom 40 per cent experienced income growth higher than the overall national average, indicating lower levels of inequality. Still, in all countries with data, the bottom 40 per cent of the population received less than 25 per cent of the overall income, while the richest 10 per cent received at least 20 per cent of total income.
Progress in shared prosperity has been strongest in Eastern and South-Eastern Asia, with the bottom 40 per cent of the population growing annually by 4.9 per cent, on average. Growth in sub-Saharan African countries has been more limited, although comparison is challenging due to limited data (available for 15 countries only). The need for improved data collection is particularly pertinent now, so that countries are able to identify and take action if the poorest are disproportionately affected by the economic impacts of COVID-19.

Women with disabilities face multiple – and intersecting – forms of discrimination
Almost two in ten people reported having personally experienced discrimination on at least one of the grounds established by international human rights law, according to data from 31 countries over the period 2014 to 2019. Moreover, women are more likely to be victims of discrimination than men. Among those with disabilities, 3 in 10 personally experienced discrimination, with higher levels still among women with disabilities. The main grounds of discrimination mentioned by these women was not the disability itself, but religion, ethnicity and sex, pointing to the urgent need for measures to tackle multiple and intersecting forms of discrimination. The COVID-19 pandemic may further entrench existing patterns of discrimination and stigma, with reports emerging from many countries of discrimination against different groups.
Workers are receiving a smaller share of the output they helped produce
In 2017, the labour income of the world’s workers represented an estimated 51 per cent of global GDP. The labour share of GDP takes into account the employment-related earnings of both employees and the self-employed, and provides an indication of whether higher national income will lead to increased material living standards for workers. The global labour income share has shown a downward trend since 2004, when it stood at 54 per cent, implying that workers are receiving a smaller proportion of the output they helped produce.
The labour income share varies considerably from one region to the other. In 2017, the labour income of workers in Northern Africa and Western Asia accounted for a little over a third of the region’s output (36 per cent). At the other end of the spectrum, the labour income share was close to 58 per cent in Europe and Northern America.
Income inequality is falling in some countries, but levels generally remain high
The Gini index is one of the most commonly used measures of income inequality. It ranges between 0 and 100, where 0 indicates that income is shared equally among all people and 100 indicates the extreme situation where one person accounts for all income. Among the 84 countries with available data, the Gini index for disposable income (or consumption expenditure) fell by at least one point in 38 countries between 2010 and 2017, meaning those countries saw a reduction in inequality. However, income inequality rose over the same period in 25 of the countries with available data.
Despite falling inequality in the vast majority of countries with a Gini index value in excess of 40 in 2010, levels of income inequality remain high in many countries. Out of 166 countries with data, 65 still had a Gini index value of over 40 in their most recent values, with 17 having an index value greater than 50. The lowest levels of income inequality were seen in Slovenia and the Czech Republic, with Gini index values below 25.
Gini index for disposable income (or consumption expenditure) by country, around 2010 and 2017
Note: If data for a reference year are not available, the nearest year within a two-year window are presented.
The global recession could constrict aid flows to developing countries
In 2018, total resource flows for development to developing countries from Development Assistance Committee of the Organization for Economic Co-operation and Development donors, multilateral agencies and other key providers totalled $271 billion in current prices, compared with $420 billion the previous year and $314 billion in 2015. ODA made up 61 per cent ($166 billion) of the total. The region that received the largest share of total resource flows was Latin America and the Caribbean ($59 billion), although this amount fell considerably from 2015 ($97 billion). Flows to Eastern and South-Eastern Asia rose slightly in nominal terms, from $50 billion in 2015 to $56 billion in 2018.
Looking ahead, the Organization for Economic Cooperation and Development projects a decline in global GDP of up to 7.6 per cent in 2020 if there is a second wave of COVID-19 infections, which could put pressure on Development Assistance Committee members’ ODA budgets. Development resource flows fell in the aftermath of the 2008 economic and financial crisis, and the global recession could again put pressure on development resources.
Total resource flows for development to developing countries, by region of recipient, 2015 and 2018 (billions of current dollars)
Most regions still have a long way to go in establishing adequate migration policies
Globally, 54 per cent of countries have a comprehensive set of policy measures to facilitate orderly, safe, regular and responsible migration and mobility of people, based on 111 countries with available data in September 2019. This means that they reported having policy measures in place for at least 80 per cent of the subcategories that make up the six policy domains of this indicator. Central and Southern Asia (80 per cent) and Latin America and the Caribbean (79 per cent) have the highest share of countries with a comprehensive set of policies, compared with just 33 per cent of countries in both Oceania and in Northern Africa and Western Asia.
Across the six domains, policies to promote cooperation and partnerships and to facilitate safe, orderly and regular migration are most widespread, with more than three quarters of Governments reporting that they met or fully met the criteria. Migrant rights and their socioeconomic well-being have the lowest proportions of Governments reporting a wide range of policy measures, at 55 per cent and 59 per cent, respectively.
Percentage of Governments reporting that they met the criteria for having a comprehensive set of policy measures to facilitate orderly, safe, regular and responsible migration and mobility of people, by region, 2019 (percentage)

Note: Based on 111 countries with available data (as of 1 September 2019).
** Data are available for less than 50 per cent of countries.
*** Data are available for less than 50 per cent of countries and for less than 50 per cent of the population.
Annualized per capita growth rate of income of the poorest 40 per cent of the population, 2012–2017 (percentage)