SDG Goals
Responsible consumption and production
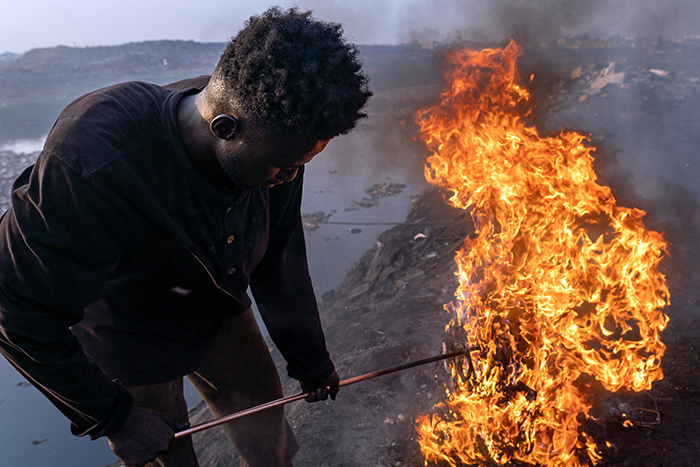
A young man in Ghana burns scrap electrical cables to recover copper after migrating from his village to Accra to engage in e-waste work.
© Fondation Carmignac/Muntaka ChasantThe world wastes 1.05 billion metric tons of food even as hundreds of millions face hunger
In 2021, 13.2 per cent of food produced globally was lost after harvest and during transport, storage, wholesale and processing. An alarming 19 per cent of all food at the retail or consumption stage was wasted in 2022, totaling 1.05 billion metric tons of all food available to consumers. Most food waste occurred in households (60 per cent); each person wasted an average of 79 kilograms annually, more than the weight of the average person. Globally, an estimated 1 billion meals of edible food are wasted every day, equivalent to 1.3 meals per person impacted by hunger per day, considering that 783 million people faced hunger in 2022.
Data suggest that household food waste varies by just 7 kilograms per capita each year across high-income, upper-middle-income and lower-middle-income countries. Hotter countries tend to have higher waste per capita, possibly due to increased consumption of fresh food with substantial inedible parts and inadequate refrigeration. Further, each year, food loss and waste generate 8 to 10 per cent of greenhouse gas emissions, costing over $1 trillion and straining land resources and biodiversity. At the same time, as of 2022, only 9 of 193 countries had included food waste in their NDCs, revealing a significant gap in connecting this issue with climate action and the objective of halving food waste and reducing losses by 2030.
High rates of consumption and insufficient reuse or recycling are producing vast piles of e-waste
Uncontrolled disposal of electronic and electrical equipment fuels vast e-waste stockpiles, exacerbated by rising consumption, short product life cycles and little repair. E-waste generation rose from 6.3 to 7.8 kilograms per capita from 2015 to 2022, reaching a total of 62 million metric tons of e-waste in 2022. Only 1.7 kilograms per capita was collected and managed in an environmentally sound manner. High-income countries achieved collection rates of over 40 per cent, yet most e-waste was inadequately recycled or exported to lower-income countries where management infrastructure is not developed, inadequate or absent. In Central and Southern Asia, Latin America and the Caribbean, and sub-Saharan Africa, collection rates are below 5 per cent. Inappropriate management by the informal sector results in environmental pollution and health hazards for workers and communities.
By 2030, e-waste generation is projected to increase to 10 kilograms per capita per year (or 82 million metric tons in total). If all countries boost their collection rates to 60 per cent, 54 million metric tons of e-waste would be managed in an environmentally sound manner, with 30 million metric tons of metal resources viably recovered. This would also prevent 34,000 kilograms of mercury emissions and 209 million metric tons of CO2-equivalent emissions in 2030.
E-waste generation and environmentally sound e-waste management, 2010-2022 and 2023-2030 projections (kilograms per capita)

More countries and companies are stepping up to report on sustainability measures
From 2019 to 2023, 62 Member States and the European Union reported 516 policy instruments to accelerate the transition to sustainable consumption and production patterns. Half the policies are national road maps or strategies; 30 per cent are legal instruments; and 14 per cent are voluntary instruments. New policies in 2023 integrated sustainable consumption and production patterns into high-impact sectors. The Philippines sought to promote responsible mining and enhance compliance with environmental laws, for instance. The United States planned to transform its food system for broader benefits. Australia's Water Efficiency Labelling and Standard Scheme initiated efforts to reduce water demand and encourage efficient technologies.
International standard setters have developed sustainability reporting standards for both the public and private sectors. While this represents positive progress, challenges persist given a lack of interoperability and inconsistency in national reporting requirements. In 2021-2022, 73 per cent of sampled companies published sustainability reports, triple the share in 2016, with growth in all regions. Reporting is more common on environmental (water, emissions and energy efficiency) and governance (gender diversity, board meetings, bribery and corruption) dimensions than on social ones (human rights, health and safety, diversity and opportunity). The number of stock exchanges with written guidance on environmental, social and governance reporting continues to grow, from fewer than 10 a decade ago to 69 in 2022.
Policy instruments aimed at supporting the shift to sustainable consumption and production, by type, 2019-2023 (percentage)

Global material consumption growth slows but regional disparities persist
Domestic material consumption measures materials directly used within an economy, including those that are extracted and imported but without those that are exported. From 2000 to 2022, domestic material consumption grew by 69 per cent, from 56.6 billion metric tons to 96.0 billion metric tons. The compound annual growth rate slowed, however, from 3.9 per cent in 2003-2012 to 0.8 per cent in 2013-2022. The global material footprint, representing raw materials extracted to meet final consumption demands, increased by 71 per cent from 57.4 billion metric tons in 2000 to 98.0 billion metric tons in 2022. Its compound annual growth rate declined from 3.9 per cent in 2003-2012 to 0.9 per cent in 2013-2022. Structural shifts in the composition of the material footprint stem from escalating reliance on non-metallic minerals and the diminishing relative impact of biomass.
In regions where the material footprint exceeds domestic material consumption, the latter decelerates faster, notably in Eastern and South-Eastern Asia, Europe and Northern America, and Northern Africa and Western Asia. In these regions, the compound annual growth rate of the material footprint declined from 3.7 per cent to 0.8 per cent from 2003-2012 to 2013-2022, while the domestic material consumption rate dropped from 3.9 to 0.5 per cent. In regions where the material footprint is lower than domestic material consumption, including Central and Southern Asia, Latin America and the Caribbean, sub-Saharan Africa and Oceania, the compound annual growth rate decreased from 4.5 to 1.3 per cent for the former and from 3.8 to 1.6 per cent for the latter from 2003‒2012 to 2013-2022. A widening regional gap between the two indicators signifies varying environmental pressure from material consumption.
Compound annual growth rate of material footprint and domestic material consumption, 2003-2012 and 2013-2022 (percentage)

Note: Material footprint (MF) is based on estimates while domestic material consumption (DMC) combines estimates and country data (mainly from European Union member States).
Monitoring tourism in line with sustainable development is progressing but more is needed
National monitoring based on the Tourism Satellite Accounts and the System of Environmental Economic Accounts provides a good indication of a country's capacity to measure the economic and environmental sustainability of tourism. In 2019, a record 99 countries used at least one table under the accounts for evaluating key tourism sustainability indicators. A subsequent decline in use from 2020 to 2022 was likely due to a natural lag in data production. While global monitoring capacities have improved across all regions since 2008, in most, less than 50 per cent of countries can report data.