SDG Goals

Industry, innovation and infrastructure
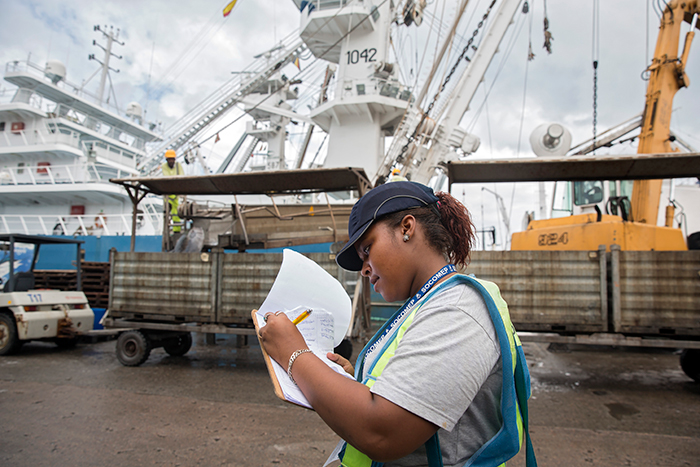
A woman works at Port Victoria, Seychelles, providing services for the country’s largest industry — industrial tuna fishing.
© UN Women/Ryan Brownprioritize and accelerate the green transition, and facilitate access to information and communications technology.
Global manufacturing shows slow growth, and the global share of manufacturing employment declines
Since 2015, the global manufacturing value added per capita has risen by 16 per cent, from $1,653 (at constant 2015 prices) to $1,922 in 2023. The manufacturing sector’s contribution to total economic activity, however, only marginally increased from 16.3 to 16.7 per cent during the same period. In 2022, manufacturing growth plateaued at around 2.7 per cent and is anticipated to remain stagnant in 2024. This can be attributed to factors including geopolitical uncertainty, inflation, logistical challenges, elevated energy costs and broader global economic deceleration.
In the LDCs, manufacturing value added per capita increased by 35 per cent from $125 in 2015 to $169 in 2023, with the share of manufacturing value added in GDP rising by 2.5 percentage points, from 12 to 14.5 per cent, respectively. Even so, the pace of progress may not be sufficient for the LDCs to reach the target of doubling their 2015 level of manufacturing value added in GDP by 2030.
Between 2015 and 2020, the global share of manufacturing employment in total employment remained relatively stable at 14.3 per cent. It dropped to 14.1 per cent in 2022, impacted by the COVID-19 pandemic and geopolitical crises that profoundly affected manufacturing sectors worldwide. Most regions witnessed a decline in the share of employment between 2021 and 2022, except for sub-Saharan Africa and Central and Southern Asia.
Manufacturing employment as a proportion of total employment, 2015, 2021 and 2022 (percentage)

*Excluding Australia and New Zealand.
After a pandemic-induced plunge, the airline industry begins a strong rebound
In 2020, international passenger traffic plunged by 60 per cent, with just 1.8 billion passengers taking to the air compared to 4.5 billion in 2019, reverting to 2003 levels. Seat capacity was cut in half. In the same year, airlines suffered $370 billion in losses due to the COVID-19 pandemic. Airports and air navigation services providers lost $115 billion and $13 billion, respectively.
A strong recovery began in 2022 as passenger numbers reached 73 per cent and revenues hit 87 per cent of 2019 levels. Air passenger numbers increased by 43 per cent and revenue passenger kilometres rose by 62 per cent over 2021 levels, driven by international route recoveries. Airlines experienced a 44 per cent growth in annual passenger revenues from 2021 to 2022.
In 2024, the air transport industry is expected to support 87.7 million jobs globally, with a direct and indirect economic impact of $3.5 trillion, equivalent to 4.1 per cent of world GDP.
Closing the mobile broadband coverage gap of 5 per cent remains a challenge
In most developing countries, mobile broadband (3G or above) is the main way – and often the only way – to connect to the Internet. Around 95 per cent of the global population now has this form of access. Bridging the “coverage gap” for the remaining 5 per cent poses significant challenges. Since surpassing the 90 per cent mark in 2018, global 3G coverage has increased by only 4 percentage points. In Oceania (excluding Australia and New Zealand), the gap remains substantial at 31 per cent. Sub-Saharan Africa has seen some progress but still faces a notable 17 per cent gap, especially in central and western Africa. Mobile broadband remains inaccessible to 18 per cent of people in the LDCs and LLDCs.
Access to credit is vital for small enterprises, but only a small share can access it
Small enterprises are the backbone of economies worldwide, providing job opportunities and supporting livelihoods across communities. Despite playing a pivotal role in closing economic and social gaps, they face myriad challenges in the aftermath of the pandemic, including rising operational expenses due to inflation in energy and transportation and high interest rates on loans. Especially in lower-income nations, small enterprises bear the brunt of shocks due to their greater vulnerability. Access to credit, crucial for their survival, remains difficult. According to survey data from 2006 to 2023, only 16.9 per cent of small-scale manufacturing industries in sub-Saharan Africa received loans or lines of credit, well below the global average of 31 per cent. Inclusive industrial policies are imperative for fostering the growth, competitiveness and resilience of small enterprises.
Proportion of small-scale industries with a loan or line of credit, 2006‒2023 (percentage)

*Excluding Australia and New Zealand.
Continued declines in CO2 emissions intensity are not yet enough to cut global emissions
In 2023, global CO2 emissions from energy combustion and industrial processes increased by 1.1 per cent to an unprecedented 37.4 gigatonnes. The rate rose at a slower pace compared to 1.3 per cent in 2022 and was significantly lower than the global GDP growth rate of 3 per cent. This deceleration can be attributed to the significant surge in clean energy technologies since 2019. Coal was the primary driver of emissions growth, contributing over 65 per cent of the uptick in 2023.
Emissions per unit of GDP consistently decreased, dropping 11.5 per cent from 0.29 kilograms per dollar (purchasing power parity) in 2015 to 0.25 in 2021. In manufacturing, emissions intensity decreased by 16 per cent, although regional disparities persist. Progress in reducing emissions intensity to cut global emissions overall has been insufficient. Developing strategies for low-carbon energy and green manufacturing calls for collaboration and approaches tailored to each country's unique strengths.
CO2 emissions per unit of manufacturing value added, 2015 and 2021 (kilograms of CO2 per constant 2015 United States dollars)

*Excluding Australia and New Zealand.
Medium- and high-tech industry demonstrate resilience despite global economic challenges
The proportion of medium- and high-tech manufacturing value added in total value added rose from 46.34 per cent in 2015 to 46.88 per cent in 2019, an upward trend slightly disrupted by the COVID-19 pandemic. The crisis highlighted the resilience of higher-technology industries, which experienced only a marginal decline of 0.67 percentage points in 2021.
Significant regional disparities exist in shares of medium- and high-tech manufacturing. In Eastern and South-Eastern Asia, the sector accounted for approximately 50.6 per cent of total manufacturing in 2021, whereas in sub-Saharan Africa, it represented just 18.3 per cent. Prioritizing investments in education and skills development is crucial to expedite the growth of medium- and high-tech industries by equipping the workforce to compete effectively in a dynamic global manufacturing landscape.
Proportion of medium- and high-tech manufacturing value added in total manufacturing value added, 2015 and 2021 (percentage)
