SDG Goals
Clean water and sanitation
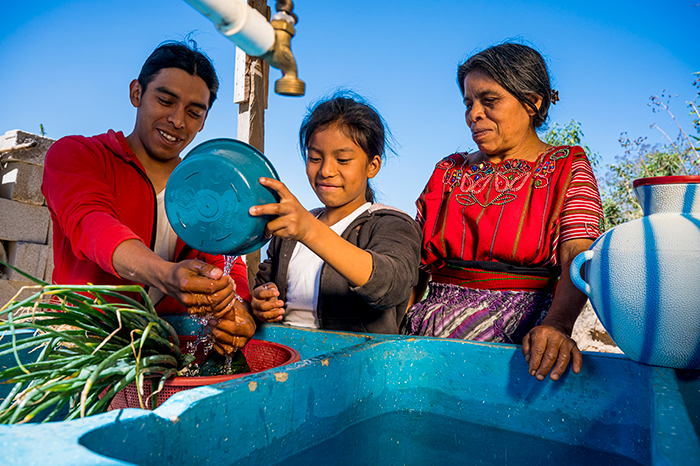
A family washes vegetables in a sink outside their home in Guatemala. The local community has improved water, sanitation and hygiene services.
© UNICEF/Sergio IzquierdoMore people have safe drinking water and sanitation but billions still go without
Between 2015 and 2022, the proportion of the population using safely managed drinking water increased from 69 to 73 per cent. Shares with safely managed sanitation rose from 49 to 57 per cent and with basic hygiene services from 67 to 75 per cent. In 2022, however, 2.2 billion people still lacked safely managed drinking water, 3.5 billion went without safely managed sanitation (including 419 million who practised open defecation) and 2 billion still had inadequate basic hygiene services (including 653 million with no facilities at all). Additionally, 1.8 billion people had no on-premises drinking water, with women primarily responsible for water collection in two out of three households. Achieving universal coverage by 2030 will require a sixfold increase in current rates of progress for safely managed drinking water, a fivefold increase for safely managed sanitation and a threefold increase for basic hygiene services.
Degraded water quality is likely a global trend yet data gaps constrain understanding and action
In 2022, based on 73 countries reporting both total wastewater generation and treatment, 76 per cent of total wastewater received some treatment. In 42 countries specifying treatment levels, 60 per cent of total wastewater flows were safely treated (with at least secondary treatment). Far fewer countries reported on the generation or treatment of industrial wastewater. Data on household wastewater from 140 countries and territories show that 58 per cent received safe treatment. Trends in domestic wastewater suggest that little, if any, progress is being made towards the target of halving the proportion of unsafe discharges by 2030. Large gaps in monitoring and reporting, particularly in low-income countries, result in an unclear picture of global wastewater.
In 2023, data on 91,000 water bodies from 120 countries revealed that 56 per cent had good water quality. Reporting on this indicator increased from 71 countries in 2017 to 120 in 2023. The 40 highest-income countries reported on 75 per cent of these water bodies, while 80 other countries reported on the remaining 25 per cent. More countries monitored rivers (101) than lakes and groundwater (71 each) due to technical challenges. This is concerning, as groundwater often constitutes the largest share of freshwater while lakes are vital ecosystems. Agriculture and untreated wastewater are major threats to water quality, releasing harmful excess nutrients. Degradation in water quality since 2017 is a concerning trend based on data from countries with extensive monitoring programmes. This trend may be global, given lower wastewater treatment rates in many low-income countries, but insufficient data limit confirmation. The lack of data obscures early warning signs, impedes restoration efforts and jeopardizes freshwater ecosystem services.
Permanent water bodies grew by over 2 per cent from 2005 to 2022
Using millions of satellite images, scientists mapped permanent water bodies globally from 2005 to 2022. The analysis revealed a net global increase of 2.1 per cent (53,672 km2) in permanent water area since 2005. Much of the increase comes from climate change and reservoir filling. While the global net gain in permanent water is positive, global data also reflect losses of permanent water linked to droughts and rising water demand in some regions, notably Australia and New Zealand, Latin America and the Caribbean, and Central Asia.
Water stress is increasing, with devastating consequences for sustainable development
The water stress level measures all freshwater withdrawals relative to total freshwater resources. A withdrawal rate above 75 per cent of renewable water resources represents high water stress; more than 100 per cent is critical. High water stress can have devastating consequences for the environment and hinder or even reverse economic and social development. Globally, the water stress level reached an average of 18.6 per cent in 2021, with Central and Southern Asia facing high stress and Northern Africa in critical stress. From 2015 to 2021, global water stress increased by 3 per cent. Stress levels in Northern Africa and Western Asia rose 12 per cent, exacerbating already critical levels. Agriculture accounts for 72 per cent of freshwater withdrawals globally, followed by industry (15 per cent) and services (13 per cent).
Level of water stress, 2021 (percentage)

* Excluding Australia and New Zealand.
Global water use efficiency has risen by varying degrees depending on the structure of economies
Global water use efficiency increased from $17.4/m3 in 2015 to $20.8/m3 in 2021, a 19 per cent increase in efficiency. Efficiency improved in all economic sectors. Agriculture saw the greatest rise, at 36 per cent, followed by industry at 31 per cent and services at 6.3 per cent. Efficiency varies widely, influenced by a country's economic structure and the sectoral distribution of water. In 2021, estimates ranged from below $3/m3 in agriculture-dependent economies to over $50/m3 in highly industrialized, service-based ones. Despite the average increase globally, around 58 per cent of countries still exhibit low water-use efficiency (less than $20/m3). Regionally, Oceania, Europe and Northern America have exceeded the global average, while Central and Southern Asia are falling behind. From 2015 to 2021, Eastern Asia and South-Eastern Asia experienced growth of 44 per cent; Latin America and the Caribbean witnessed a 7 per cent decline. Countries are adopting various strategies to enhance water use efficiency, including infrastructure modernization, more efficient irrigation and wastewater reuse.
Much more effort is needed to realize the full potential of transboundary water cooperation
Cooperative agreements among countries sharing transboundary water resources (rivers, lakes and aquifers) are essential for advancing sustainable development and addressing climate change. In 2024, only 43 out of 153 Member States sharing transboundary waters have operational arrangements covering 90 per cent or more of these resources. Over 20 countries lack any such arrangements. While progress has been notable in sub-Saharan Africa, where 16 countries now cover 90 per cent of their transboundary basins with operational arrangements, only a few countries in Asia, Latin America and North Africa have adequate arrangements. Alarmingly, nearly 43 per cent of countries lack flood alarm systems for any of their transboundary water bodies, 63 per cent go without drought alarm systems, 59 per cent have no joint climate change adaptation strategies for any of their transboundary basins and 64 per cent have yet to enact joint disaster risk reduction strategies. Since 2020, only around 10 new cooperation arrangements have been adopted for previously uncovered transboundary water bodies. Achieving coverage of all transboundary basins by 2030 will require significantly accelerated progress.
Integrated water management boosts resilience to multiple crises, including climate change
Tackling climate change, water scarcity and other crises requires a comprehensive approach to managing water resources, across sectors and borders. Countries with higher levels of integrated water resources management (score 0 to 100 per cent) are more resilient to climate change, biodiversity loss and pollution. Global progress in implementing integrated water resources management remains slow, however, edging up from a score of 49 per cent in 2017 to only 57 per cent in 2023, far short of the 2030 target of 91 to 100 per cent. Significant efforts to accelerate implementation are needed, particularly in Central and Southern Asia, Latin America and the Caribbean, Oceania and sub-Saharan Africa. Countries report that their main challenges are the lack of coordination across sectors and insufficient financial, institutional and technical capacity. Successful countries demonstrate that mainstreaming water resources in climate planning and financing allows them to build resilience and advance multiple development objectives, including for food, energy and ecosystems.
Implementation levels of integrated water resources management, 2023 or latest available year
