SDG Goals
Partnerships for the Goals
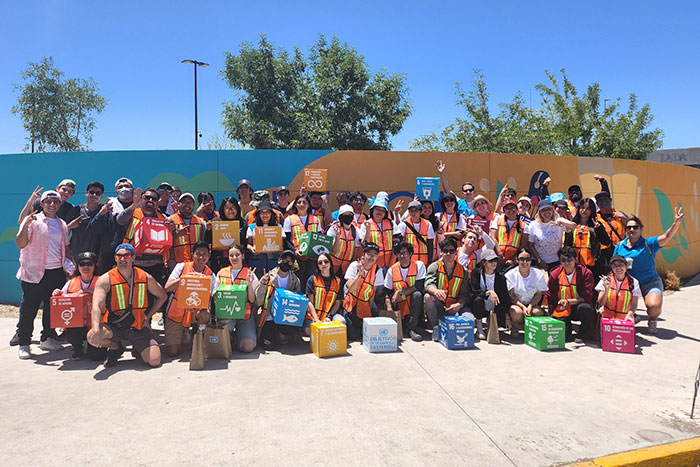
Around 200 young volunteers participate in placemaking interventions, designing solutions to make public spaces more inviting and enjoyable, in Ciudad Juárez, Mexico.
© UN-Habitat Mexicodigital infrastructure support and strengthened statistical capacity for better SDG tracking and implementation.
Debt service costs for low- and middle-income countries hit a record $1.4 trillion
The total debt servicing costs (principal plus interest payments) for all LMICs reached a record of $1.4 trillion in 2023. The increase in total debt service payments is a direct outcome of the rapid accumulation of external debt over the past decade, interest rates that hit a two-decade high and depreciation of local currencies against a strong United States dollar. This significantly exceeds pre-pandemic levels. In 2023, LMICs spent 3.7 per cent of their gross national income (GNI) to service their debt, straining already limited resources and leaving less room for investments in health, education, and infrastructure.
Principal repayments rose nearly 1 per cent to $950.9 billion, while interest payments surged 37.1 per cent to $405.3 billion ‒ both at all-time highs. Consequently, the debt-service-to-exports ratio deteriorated by 1.6 percentage points to 14.7 per cent for LMICs in 2023. The ratio of debt service on public and publicly guaranteed debt to export earnings increased to 4.4 per cent in 2023, after a two-year decline to 4.3 per cent in 2022.
Interest payments on the total external debt of low- and middle-income countries, by region and creditor type, 2021–2023 (billions of current dollars)

Note: Regional classifications follow the World Bank grouping.
Share of developing countries in global trade remains stagnant since 2015
Trade can drive sustainable development when participation is equitable in global markets. After steady increases in the early 2000s and 2010s, the share of merchandise exports from developing regions has stagnated since 2015. For 2023’s global exports, the share of Europe and Northern America was nearly half, and that of Eastern and South-Eastern Asia made up almost a third. The contributions of other regions remained low, between 1.7 and 7.5 per cent. SIDS saw their share decline slightly from 2.4 per cent in 2015 to 2.3 per cent in 2023. LLDCs and LDCs showed minimal gains, reaching only 1.2 and 1.1 per cent, respectively. This is markedly off the SDG target to significantly increase the exports of developing countries and double the export share of LDCs by 2020. Both LLDCs and LDCs have maintained negative trade balances since 2015.
Unlike merchandise exports, developing regions have struggled to expand their share of global services trade. In 2023, developed regions dominate service exports at 70 per cent, while developing regions contribute 30 per cent, with developing Asia making up the largest share at 25 per cent.
Share of global merchandise exports, 2015 and 2023 (percentage)

Official development assistance falls in 2024 after five years of consecutive growth
In 2024, ODA by member countries of the Development Assistance Committee (DAC) amounted to $212.1 billion on a grant equivalent basis, representing 0.33 per cent of the DAC members’ combined GNI. This marked a 7.1 per cent decline in real terms from 2023, marking the first drop after five years of consecutive growth. The decrease was driven by reduced contributions to international organizations, lower aid for Ukraine, decreased humanitarian aid and reduced spending on hosting refugees in donor countries. Net ODA flows reached $209.8 billion in 2024, representing a 9.3 per cent decline in real terms from 2023.
Between 2019 and 2023, ODA increased by 33 per cent in real terms as most DAC members expanded their aid budgets to help developing countries address consecutive global crises ‒ the COVID-19 pandemic and Russia’s war against Ukraine. Despite the 2024 decline, ODA remained 23 per cent above 2019 levels. However, the downward trend is expected to continue. A recent survey and available information show that ODA could fall an additional 9–17 per cent from 2024 to 2025, as several donors have announced ODA budget cuts.
Development finance flows increased across multiple sources
In 2023, financial resources for developing countries from 106 bilateral and multilateral providers totalled $303 billion in official resources and $58.7 billion in mobilized private finance. All financing forms have increased since 2019 ($205.9 billion official, $46.7 billion private), with concessional loans showing the largest growth at 77 per cent.
Global foreign direct investment (FDI) reached an estimated $1.4 trillion in 2024, up 11 per cent from 2023, though falling 8 per cent when excluding flows through European conduit economies. SDG-related investments declined 11 per cent in 2024. While renewable energy, health and education sectors saw gains, three critical areas ‒ infrastructure, agrifood systems, and water and sanitation ‒ now receive less international financing than in 2015.
Global remittance flows totalled $861 billion in 2023, a 3 per cent increase from 2022. Flows to LMICs grew 1.4 per cent to reach $647 billion, slowing from an average 10 per cent growth in 2021–2022. The actual size of remittance flows is likely larger when including informal channels. The moderation reflects normalization after post-pandemic increases, supported by strong labour markets in advanced economies.
Internet use continues to grow, but universal connectivity remains a distant prospect
In 2024, 5.5 billion people were online, representing 68 per cent of the world population. However, one third of the global population (2.6 billion) remain offline. While global Internet use has grown from 40 per cent in 2015 to 68 per cent in 2024 (equal to an annual average growth rate of 6.1 per cent), universal usage ‒ 95 per cent penetration ‒ remains a distant prospect. Internet use remains tightly linked to the level of development. Universal use has been achieved or nearly achieved in Australia and New Zealand, as well as Europe and Northern America, while sub-Saharan Africa and Oceania (excluding Australia and New Zealand) are lagging, with only 37 and 33 per cent of people online, respectively. Among LDCs and LLDCs, Internet use stands at just 35 and 39 per cent, respectively. Globally, 70 per cent of men were online, compared with 65 per cent of women, leaving 189 million more men than women connected in 2024. This difference has been decreasing since 2021, when it stood at 277 million.
Proportion of individuals using the Internet, 2015–2024 (percentage)

*Excluding Australia and New Zealand.
Statistical capacity improves, but sustainable investment is needed across all countries
High-quality, timely and disaggregated data are vital for SDG progress. Despite COVID-19 disruptions, national statistical systems have strengthened. The average Open Data Inventory (ODIN) score increased sharply from 2022 to 2024 across all regions; for the first time, the global score surpassed 50 out of 100. Economic and environmental data saw the strongest gains, while social and demographic data lagged. Even in developed countries, the average ODIN score is only 60, highlighting the urgent need for increased investment in data infrastructure and production across all countries. Similarly, Statistical Performance Indicator (SPI) scores rose from 58.6 in 2016 to 69.7 in 2023, owing to the heightened demand for reliable data during the COVID-19 pandemic. However, progress has stalled in several regions, and low-income countries continue to lag due to limited resources and capacity.
In 2024, 159 countries and territories reported having national statistical legislation in compliance with the Fundamental Principles of Official Statistics, up from 132 countries in 2019, and 137 countries reported implementing a national statistical plan, though only 95 were fully funded. Sustainable financing remains a key challenge for addressing evolving data needs.