SDG Goals
Reduced inequalities
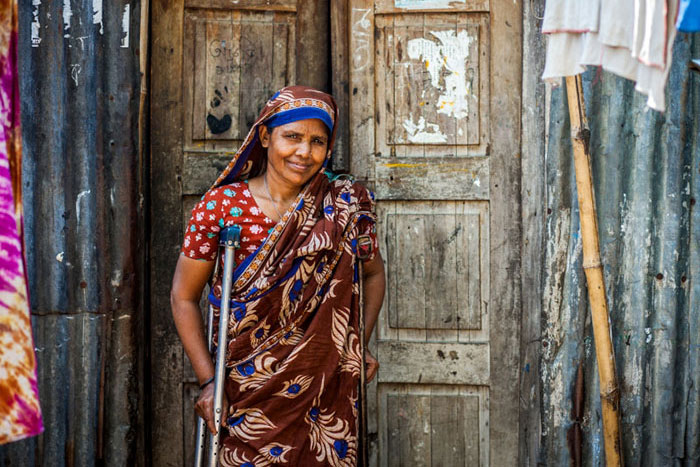
A woman with disabilities in Bangladesh. Persons with disabilities face higher levels of discrimination and were disproportionately impacted by recent crises, including the COVID-19 pandemic
© UNDP Bangladesh/Fahad KaizerPoorer economies are less likely to experience above-average growth among the bottom 40 per cent of the population
Since 2015, about 6 in 10 of the 108 countries with at least two recent surveys have achieved higher income and consumption growth for the bottom 40 per cent of the population compared to the national average. Eastern and South-Eastern Asia, as well as Europe and Northern America, demonstrated more consistent pro-poor growth on average, both before and after the COVID-19 pandemic. Conversely, in Central and Southern Asia, only three out of seven countries with available data managed higher growth for the bottom 40 per cent relative to the national average.
Fewer than half of low- and lower-middle-income countries have managed to foster higher growth among the bottom 40 per cent compared to the national average. In contrast, 7 out of 10 upper-middle- and high-income countries have achieved more rapid growth for their bottom 40 per cent.
Share of countries where income and consumption growth of the poorest 40 per cent of the population is higher than the national average, by country income level, since 2015 (percentage)

Note: This chart compares progress within countries between 2015 and the most recent year where data are available (with a median of 2021).
Less of GDP is going towards labour income, increasing the gap between workers and owners of capital
In 2024, 57 per cent of working-age persons were employed worldwide, meaning that labour income directly impacts the lives of 3.6 billion workers and their families. Globally, the labour income share of GDP fell from 52.9 per cent in 2015 to 52.3 per cent in 2024, equivalent to an average loss of $255 (in 2021 PPP) per worker annually. This decline signals that productivity gains are not translating into higher wages. Instead, a growing share of economic gains is going to capital, concentrated among the wealthy, thereby widening inequality.
Most regions saw a decline in the labour income share between 2015 and 2024, a period marked by COVID-19's economic impacts. The drop was particularly sharp in SIDS (2.6 percentage points), LLDCs (1.4 percentage points), and Latin America and the Caribbean (1.3 percentage points). Conversely, Central and Southern Asia experienced an increase. LDCs also saw a minor rise, albeit from a much lower base.
Labour income share of GDP, 2015 and 2024 (percentage)

* Excluding Australia and New Zealand.
Discrimination is on the rise globally, with certain population groups bearing the brunt
Fresh evidence from 119 countries reveals who is being left behind and a troubling upward trajectory in global discrimination. Among countries with multiple survey rounds, average discrimination on any ground increased from 14.8 to 17.1 per cent. Nations experiencing rising discrimination outnumber those making progress by two to one.
Discrimination is neither rare nor random. It is a widespread and patterned experience, deeply rooted in social identity and status. Globally, one in five people report having been discriminated against on at least one ground prohibited by international law in the past 12 months, with LDCs reporting the highest rates averaging 24.3 per cent.
Key disparities emerge across demographics. Urban residents report nearly double the discrimination rate of their rural counterparts. Women are twice as likely to face gender-based discrimination. Persons with disabilities face discrimination at 28 per cent compared to the 17 per cent for those without disabilities. Economic status strongly correlates with discrimination; the poorest quintile reports a 17.3 per cent rate versus the 10.3 per cent rate reported by the wealthiest. Education matters as individuals with no formal education face a 21.4 per cent rate, nearly double that of those with higher education (12.7 per cent). Age shapes the reasons for discrimination. Youth (15–29 years) more often report discrimination based on migration status, ethnicity and sexual orientation, while older adults (60+ years) encounter age, disability and health-related discrimination.
Proportion of the population experiencing discrimination in the past 12 months, by education level and by ground, latest data (percentage)

Note: Survey years vary across countries. This chart is based on the latest available data.
Global refugee population surges to 37.8 million
By mid-2024, the global refugee population under the mandate of the United Nations High Commissioner for Refugees (UNHCR), including persons in refugee-like situations and others needing international protection, reached 37.8 million. Two thirds of all refugees originate from just four countries: Afghanistan, the Syrian Arab Republic, Ukraine and the Bolivarian Republic of Venezuela. The global refugee ratio stood at 460 per 100,000 people worldwide – more than twice the rate in 2015 and over three times the level in 2005.
Resource flows for developing countries increase, with official development assistance making up a bigger share of the total
Total resource flows to developing countries reached $429 billion in 2023, an increase from $290 billion in 2015 (in constant 2023 prices). ODA dominated these flows at $259 billion, with its share of total flows rising from 55 per cent in 2015 to 60 per cent in 2023. Other official flows amounted to $48.6 billion, and private sector instruments were $5.5 billion. Private flows, which are more volatile and fell sharply during the COVID-19 pandemic, recovered to $116 billion.
Asia received the largest volume of flows at $141 billion (32 per cent of total flows) in 2023, followed by Africa at $91 billion (21 per cent). LDCs received $80 billion. The United States, Germany and Japan were the largest contributors, providing $175.7 billion, $73.7 billion and $45.9 billion, respectively.
Remittance costs remain stubbornly high, far exceeding SDG target
The global average cost of sending $200 was 6.7 per cent in the second quarter of 2024, more than double the SDG target of 3 per cent and up from 6.2 per cent a year earlier. Digital remittances, which made up 30 per cent of transactions, averaged 5.3 per cent, while non-digital methods cost 7.2 per cent. The cost of sending money from the Group of 20 countries, which represent a significant source of remittances globally, increased slightly more than the global average cost. All developing-country regions posted an increase in total average costs, except Latin America and the Caribbean. Contributing factors included higher foreign-exchange margins and increased fees in some corridors, and a temporary suspension of several low-cost services due to the end of exclusive partnerships between providers.
Banks continued to be the most expensive channel, costing 13.4 per cent in 2024, up from 12.1 per cent in 2023. The average cost for post offices was 7.5 per cent and 5.6 per cent for money transfer operators. Mobile operators charged the lowest rate at 3.9 per cent, but they accounted for less than 1 per cent of the total transaction volume.
Average cost of sending $200 in remittances, 2023 and 2024 (percentage)
