SDG Goals
Industry, innovation and infrastructure
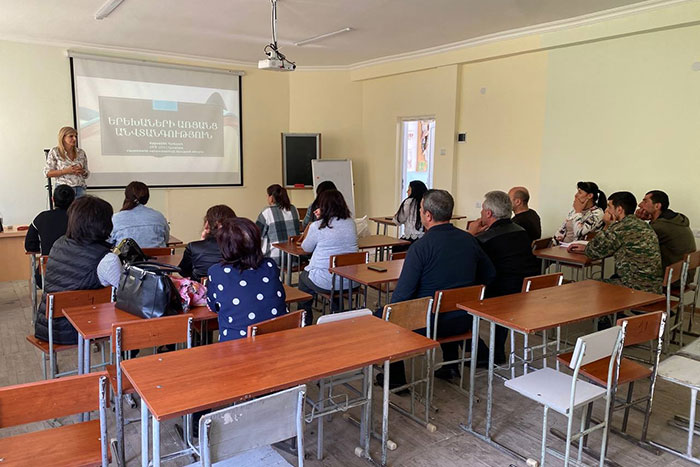
Community members attend an information meeting on the benefits of broadband connectivity in a rural village in Armenia. Projects like ITU’s Rural Networks Pilot in Armenia boost connectivity, innovation and sustainable development.
© Union of Operators of Armeniafor small manufacturers, and bridge the digital divide by prioritizing affordable broadband and innovation systems in the world’s most underserved regions.
Developing countries handle the majority of world maritime freight volumes
Global maritime freight has transformed over the past two decades amid globalization, technological change, global disruptions, and geopolitical challenges. In 2023, maritime freight volumes reached 11.6 billion metric tons, up from 6.2 and 10.3 billion metric tons in 2000 and 2015, respectively, showing remarkable resilience.
Developing countries have dramatically shifted from primarily exporting raw materials to becoming major importers and exporters of finished and semi-finished products. Their share of global maritime freight grew from 38 per cent in 2000 to 49 per cent in 2015 and 54 per cent in 2023, overtaking developed economies in 2017. Asia, particularly China, led this growth while Europe’s share declined. The Americas showed moderate progress. LDCs and SIDS contribute limited shares, reflecting their trade structure, economic size, transport infrastructure, and marginalization from global manufacturing networks and supply chains. .
Share of global maritime freight volume, by economy group, 2000–2023 (percentage)

Global manufacturing growth shows progress, but with regional disparities
Since 2015, global MVA per capita has grown by 17.3 per cent, from $1,649 (at constant 2015 prices) to $1,934 in 2024. After a smaller 1.6 per cent annual growth in 2023, the sector rebounded with an estimated 2.7 per cent annual growth in 2024. However, the MVA share of the global GDP has remained steady at 16.5 per cent in both 2023 and 2024. Central and Southern Asia saw the strongest gains, with the MVA per capita increasing by 42.1 per cent from 2015 to 2024. Meanwhile, sub-Saharan Africa, Latin America and the Caribbean, and Australia and New Zealand experienced declines of 5.9, 8.0, and 10.5 per cent, respectively. LDCs showed an impressive 40.6 per cent growth in MVA per capita since 2015, but this still falls short of the 2030 target to double the MVA share of their GDP.
Manufacturing employment dropped from 14.3 per cent of global employment in 2015 to 14.2 per cent in 2024, due to COVID-19 disruptions, supply chain issues, and geopolitical tensions – signaling weakened industrial capacity and resilience. Most regions have seen a decline in manufacturing employment since 2015, with Australia and New Zealand facing the steepest drop of 1.9 percentage points.
Annual growth of manufacturing value added, 2015–2024 (percentage)

Global CO2 emissions hit record high despite clean energy gains
Global carbon dioxide (CO₂) emissions from fuel combustion and industrial processes surged to a record high of 37.6 gigatons (Gt; 1 Gt = 1 billion metric tons) in 2024, marking a 0.8 per cent increase from 2023 and 8.3 per cent from 2015. While emissions from industrial processes declined, emissions from fuel combustion rose by 1 per cent, driven by increased natural-gas and coal consumption.
Emerging markets and developing economies contributed to a 1.5 per cent rise in energy-related emissions, driven by rapid population and economic growth. Conversely, advanced economies saw a decrease, with emission cut by 1.1 per cent, mainly through reductions in coal and oil use. Record-high global temperatures in 2024 led to greater electricity demand for cooling, adding approximately 0.230 Gt of CO₂ emissions. Despite these challenges, the expansion of clean energy technologies has significantly curbed emissions growth. Between 2019 and 2024, the expansion of solar power, wind power, nuclear energy, electric cars, and heat pumps prevented 2.6 Gt of annual CO₂ emissions. Without these technologies, the increase in global emissions since 2019 would have been three times larger.
Access to 5G now reaches half the globe, but some have zero mobile-broadband network access
Although 5G coverage has expanded to reach 51 per cent of the global population in 2024 – just five years since its commercial launch in 2019 – progress is uneven. While 84 per cent of people in high-income countries have access to 5G, coverage is only 4 per cent in low-income nations.
Where 5G technology is unavailable, 4G remains a strong alternative, covering 92 per cent of the world population. Yet, in low-income countries, 4G coverage reaches only 52 per cent of the population, and 3G remains a crucial technology for Internet connectivity.
Despite advancements, 4 per cent of the global population remains beyond the reach of mobile broadband; the largest gaps are in Oceania (excluding Australia and New Zealand), where 24 per cent do not have any access. LDCs and LLDCs also face significant challenges, with 15 and 14 per cent of their populations, respectively, lacking mobile broadband access.
Proportion of population covered by a mobile network, 2024 (percentage)

*Excluding Australia and New Zealand.
Despite global growth in research capacity, certain regions are left behind
Since 2015, the global research workforce has grown annually by 4.3 per cent, from 1,137 to 1,420 researchers per million people in 2022. Eastern and South-Eastern Asia led this surge with a 5.3 per cent growth rate, while Europe and Northern America continued to have the highest researcher densities, increasing from 3,513 to 4,254 per million inhabitants. Meanwhile, sub-Saharan Africa remained stagnant at 91 researchers per million, underscoring persistent disparities in research capacity.
Global investment in R&D grew by 5.1 per cent annually from 2015 to 2022, despite COVID-19 disruptions. The share of the global GDP invested in R&D climbed from 1.72 to 1.95 per cent during this period, driven largely by Europe and Northern America as well as Eastern and South-Eastern Asia. However, Latin America and the Caribbean as well as Central and Southern Asia saw decreases. To foster inclusive and sustainable innovation, stronger policy commitments are essential for building research capacity in developing regions and for narrowing global gaps.
Research and development expenditure as a proportion of GDP, 2015–2022 (percentage)

More inclusive financing is needed for small enterprises
According to global survey data from 2006 to 2024, only 31 per cent of small manufacturing enterprises have a loan or line of credit, revealing low financial accessibility as a significant barrier to growth. In today’s economic climate – marked by geopolitical tensions, economic sanctions, and rising uncertainty – small enterprises are especially vulnerable to shocks, particularly in lower-income countries, where financial risks are significantly higher. Just 18 per cent of small-scale manufacturing firms in sub-Saharan Africa received loans or lines of credit, compared to the 46 per cent in Latin America and the Caribbean. Improving financial inclusion and providing targeted policy support can help bridge this gap, ensuring that small enterprises can thrive despite economic uncertainties.