SDG Goals
End poverty in all its forms everywhere
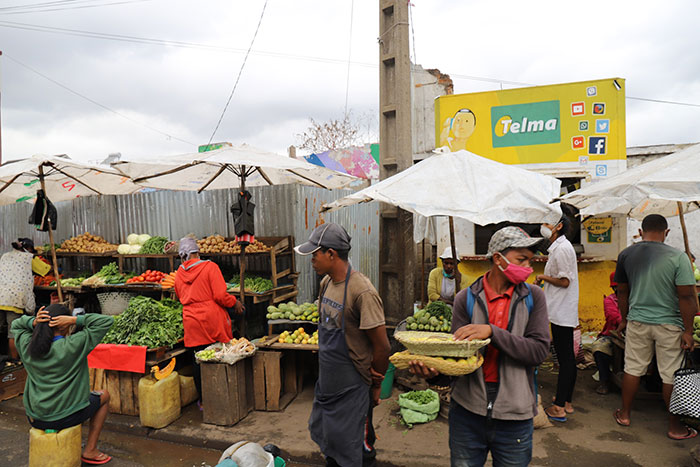
In Antananarivo, Madagascar, vendors sell vegetables in local markets – a vital lifeline for many in the informal economy that remains highly vulnerable to economic shocks and climate change.
© ILO/E. Raboanalytarget resources to the most vulnerable populations.
Revised poverty estimates show more people in extreme poverty, putting the 2030 goal further out of reach
The World Bank revised global poverty estimates using updated price data and national poverty lines from over 160 countries in June 2025. The international poverty line was raised from $2.15 (2017 purchasing power parity (PPP)) to $3.00 (2021 PPP). Under the new threshold, 1.5 billion people escaped poverty between 1990 and 2022—compared to 1.3 billion under the previous line. However, the update leads to an upward revision of extreme poverty. In 2025, an estimated 808 million people will be living in extreme poverty—up from the previous estimate of 677 million—representing 9.9 per cent of the world's population, or 1 in 10 people. Eradicating extreme poverty by 2030 appears highly unlikely due to slow recovery from COVID-19 impacts, economic instability, climate shocks, and sluggish growth in sub-Saharan Africa. By 2025, more than three-quarters of the global extreme poor will live in sub-Saharan Africa or in fragile and conflict-affected countries.
Concerning the SDG target of halving national poverty rates by 2030, all regions are projected to see a decline in average national poverty rates. However, only one in five countries is on track to achieve the target of halving its national poverty rate by 2030.
Proportion of the population living below $3/day in 2021 PPP and $2.15/day in 2017 PPP, 1990–2030 (percentage)

Note: The poverty data shown here are based on the September 2024 World Bank Poverty and Inequality Platform (PIP) vintage with the 2017 PPPs and the June 2025 PIP vintage with the 2021 PPPs. Hence, the difference between the two series is not only due to new PPPs and the new international poverty line, but also due to the inclusion of new survey data. Dashed lines are projected data or nowcasts.
Working poverty rate has decreased worldwide but persists in vulnerable regions
Worldwide, working poverty has significantly declined over the past 25 years, but recent trends in most regions suggest a slowdown in progress. In 2024, 6.9 per cent of the employed population – more than 240 million workers worldwide – lived on less than $2.15 per day in 2017 PPP, down from 8.4 per cent in 2015.
Eastern and South-Eastern Asia and Central and Southern Asia have made significant progress, reducing their shares of the working poor by half or more since 2015. However, working poverty rates remain persistently high in the world’s most vulnerable countries. In 2024, nearly 3 in 10 workers in the least developed countries (LDCs) and 2 in 10 in landlocked developing countries (LLDCs) lived in extreme poverty. In small island developing States (SIDS), the rate rose from 8.9 per cent in 2015 to 9.5 per cent in 2024.
Proportion of the employed population living below $2.15/day in 2017 PPP, 2015 and 2024 (percentage)

Social protection coverage is on the rise, but billions are still unprotected
For the first time, more than half of the world’s population (52.4 per cent) was covered by at least one social protection benefit in 2023, up from 42.8 per cent in 2015. Despite this progress, 3.8 billion people remained unprotected. While high-income countries are approaching universal coverage (85.9 per cent) and upper-middle-income countries (71.2 per cent) have made substantial progress, coverage in low-income countries (9.7 per cent) has barely shifted since 2015. Gender disparities persist, with the effective coverage of women (50.1 per cent) lagging behind that of men (54.6 per cent).
Investment disparities explain the coverage gaps. Countries spent on average 19.3 per cent of their gross domestic product (GDP) on social protection in 2023, but that proportion ranged widely from 24.9 per cent in high-income countries to just 2.0 per cent in low-income countries. Guaranteeing basic social security floors in low- and middle-income countries requires an additional $1.4 trillion annually, or 3.3 per cent of their aggregate GDP in 2024.
Proportion of the population covered by at least one social protection benefit, by country income level, 2015 and 2023 (percentage)

Many feel secure in their land rights, but formal documentation remains limited and unequal
Based on data from 85 countries in 2022, two thirds (66 per cent) of the population believe they enjoy secure tenure rights to land. However, only 43 per cent of adults possess official land tenure documents, and just 15 per cent of adults in sub-Saharan Africa. This means nearly 1.4 billion adults in developing regions are excluded from formal land markets and from access to mortgage-based finance, and they lack legal ways to protect their rights to land. In one in five reporting countries, fewer than 1 in 10 adults hold official land documentation, with people living in poverty and those in rural areas disproportionately affected. Women represent half of those who believe they are secure in their land rights and those who feel protected from eviction. However, only 24 per cent of women hold legal land documents, accounting for just 3 in 10 of all documented landholders.
Despite these challenges, customary and other informal tenure arrangements continue to provide a sense of tenure security, particularly in rural areas. In 27 countries with data, between 82 and 89 per cent of the population feel secure in their land rights, even when access to formal legal documentation remains beyond reach.
Proportion of the adult population with legally recognized documentation of their rights to land, with secure tenure rights to land, and who perceive their rights to land as secure, latest data from 2022 (percentage)

Governments are spending more on essential services, but there is a 20-point gap between advanced and developing economies
Data from 100 reporting countries show that in 2023 the proportion of total government spending on essential services (education, health and social protection) averaged around 46 per cent – 60 per cent in advanced economies and 43 per cent in emerging market and developing economies. While spending on essential services has trended upward for both economic groups over the past two decades, the gap between the two groups remains stable at approximately 20 percentage points. The gap is mainly attributed to the higher spending for social protection (15 percentage points) and, to a lesser extent, health (5 percentage points) in advanced economies.
During the COVID-19 pandemic, government expenditure on social protection and health rose while education spending fell – partly due to school closures. These shifts were expected to be temporary with pandemic effects fading. However, prolonged health issues and disrupted education may have lasting impacts on human capital.
Direct transfers benefit the poorest the most, while education and health spending vary significantly
Pro-poor public social spending is defined as the proportion of government spending benefiting the bottom 20 per cent of the income distribution in education, health and direct transfers. In the 51 countries for which data are available for all three sectors, on average, 26 per cent of government spending benefits the bottom 20 per cent of the population in the most recent year with data, though this share ranges from 10 to 39 per cent across countries.
Spending patterns differ across sectors. Direct transfers are the most pro-poor sector, with 33 per cent of cash and near-cash transfers benefiting the poorest quintile of the income distribution. In education, spending is only slightly pro-poor, with 22 per cent of funds reaching the poorest 20 per cent. In health, spending benefiting the lowest-income quintile varies significantly among countries, ranging from 9 and 59 per cent with an average of 19 per cent.