SDG Goals
Responsible consumption and production
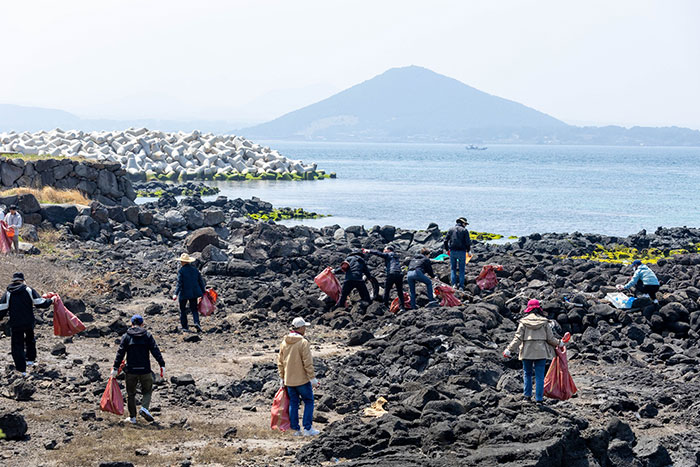
People participate in plogging – jogging while collecting litter – in Jeju, Republic of Korea. In 2022, the province declared a vision to become free of plastic pollution by 2040.
© UNEP/Artan JamRising number of countries implement sustainability policies and procurement reporting
As of 2024, 530 policies related to sustainable consumption and production (SCP) were submitted across 71 countries, a 6 per cent increase from 2023. While European and Central Asian nations continue to lead in policy volume, new submissions from Bangladesh, the Cook Islands, Kenya and Madagascar signal broader regional engagement. However, challenges and barriers persist, including a lack of integrated SDG reporting and limited human resources to consolidate inputs for submission. Moving forward, efforts must focus on scaling up impactful policies, enhancing policy effectiveness and translating SCP commitments into tangible environmental and economic benefits.
Progress is also evident in sustainable public procurement initiatives. The number of reporting countries rose from 40 in 2020 to 67 in 2022 and is expected to grow further in 2025. This momentum is supported by initiatives like the Global Framework for Action, launched at the twenty-ninth United Nations Climate Change Conference (COP29), which promotes sustainable and circular procurement as a driver of demand for near-zero emissions and resilient buildings.
Sustainability reporting is now a standard for the largest companies
Sustainability reporting has become standard for large companies, with reports from 96 per cent of the world’s 250 largest companies by revenue and from 79 per cent of the top 100 companies. Driven by mandatory reporting and international standards, the number of sustainability reports grew nearly fourfold between 2016 and 2023, led by companies in Asia, Europe and North America. Since 2016, the finance, insurance and manufacturing sectors have led in sustainability reporting. Companies most often report on emissions, energy efficiency and CO₂ equivalents, with a growing emphasis on climate-related disclosures, including carbon targets and biodiversity. Governance topics ‒ such as board meetings, audit committee independence and gender diversity ‒ are widely covered. Social reporting focuses on human rights, health and safety, and diversity policies. While setting targets based on the SDGs was once common, recent trends in corporate sustainability reports show a slight decline in this approach.
Daily food waste from households could have provided over a billion meals
Food waste in retail, food service and households reached 1.05 billion metric tons in 2022 (132 kilograms per person), representing one fifth of all food available to consumers. Households discard enough food daily to provide over a billion meals, even as 1 in 11 people worldwide go hungry and 1 in 3 cannot afford a healthy diet. When combined with the 13 per cent of food lost along supply chains, the environmental toll is staggering: food loss and waste generated 8–10 per cent of global greenhouse gas emissions, while significant amounts of land, water and resources are used to grow food that is never eaten. The economic cost is estimated to exceed $1 trillion annually.
Food waste is not just a “rich-country” problem; in high-, upper-middle- and lower-middle-income countries, the average household waste differs by just 7 kilograms per person per year. Yet progress is possible: the United Kingdom and Japan reduced food waste by 18 and 31 per cent, respectively. More Governments and industries are embracing new solutions and public-private partnerships to prevent and reduce food waste.
Household food waste in high-, upper-middle- and lower-middle-income countries, 2022 (kilograms per capita per year)

Note: The chart was based on data from 87 high- and middle-income countries. Low-income countries are not included due to its much smaller sample size.
Despite record levels of e-waste, only a fraction is disposed responsibly
In 2022, 96 billion kilograms of electrical and electronic equipment (EEE) entered the market globally, over 50 per cent more than in 2010. This surge has fuelled record levels of electronic waste (e-waste), which reached 62 billion kilograms (7.8 kilograms per capita) in 2022 and is projected to rise to 82 billion kilograms in 2030. Nevertheless, regional disparities are significant: per capita e-waste generation in Europe and Northern America and in Australia and New Zealand, is around 10 times higher than that in Oceania (excluding Australia and New Zealand) or sub-Saharan Africa.
Only 22.3 per cent, or 1.7 kilogram per capita, of generated e-waste was documented as having been formally collected and treated in an environmentally sound manner in 2022, following a downward trend since at least 2010. Significant transboundary movement of e-waste has been documented globally, with an estimated 5.1 billion kilograms of used EEE and e-waste shipped across borders annually. However, only about 35 per cent of this trade is classified as “controlled” ‒ those reported as movements of hazardous waste with prior informed consent under the Basel Convention. The majority of transboundary trade involves “uncontrolled” movements, meaning its treatment is unknown and likely not managed in an environmentally sound manner. Stronger regulation and investment in technology are vital to improving recycling rates, especially for metal fractions and critical raw materials, and for ensuring environmentally sound management of the world’s fastest-growing waste stream.
E-waste generated and recycled, 2022 (kilograms per capita)

*Excluding Australia and New Zealand.
Global resource demand surges, outpacing population growth
Domestic material consumption (DMC) measures the total amount of materials directly utilized within an economy, excluding the raw-material equivalents of traded products. It accounts for domestic material extraction plus the physical balance of material imports and exports. Between 2015 and 2022, global DMC increased by 23.3 per cent, rising from 92.1 to 113.6 billion metric tons, while DMC per capita grew by 14.8 per cent, from 12.4 to 14.2 metric tons per capita. Increasing consumption patterns were the primary driver of DMC trends during this period, outweighing the impact of population growth. Latin America and the Caribbean saw the highest rise, 132 per cent. Non-metallic minerals drove the overall increase, growing 39.0 per cent, from 43.4 to 60.3 billion metric tons between 2015 and 2022. Biomass, metal ores and fossil fuels grew by 11.8, 7.4 and 6.2 per cent, respectively.
Material footprint (MF), an indicator representing raw materials extracted to meet final consumption demands, exhibited similar overall dynamics globally, increasing by 21.3 per cent between 2015 and 2022. Comparison of DMC and MF by region shows that DMC is higher than MF in regions such as Australia and New Zealand, Central and Southern Asia, and sub-Saharan Africa; meanwhile, Eastern and South-Eastern Asia, and Europe and Northern America demonstrate the opposite trend, indicating regional inequalities in material distribution and consumption.
Domestic material consumption, by material, 2015 and 2022 (billion metric tons)

Global cooperation enhances transparency on hazardous waste and chemicals
Parties to key multilateral environmental agreements on chemicals and wastes continue to demonstrate strong compliance with reporting obligations. Under the Minamata Convention, 94 per cent of Parties had nominated focal points, and 82 per cent submitted national reports for 2021–2022. Under the Basel, Rotterdam and Stockholm Conventions, all Parties had designated at least one national contact point, facilitating the required transmission of information. A milestone was reached under the Basel Convention, with 70 per cent of Parties submitting reports for 2020 ‒ the first time a reporting target was met. For the 2023 cycle, 107 Parties have already submitted reports. Similarly, the fifth and most recent round of reporting under the Stockholm Convention in 2022 saw submissions from 91 countries. The Montreal Protocol stands out for its consistent 100 per cent compliance with reporting obligations, enabling effective monitoring and assessment of progress in phasing out ozone-depleting substances.