ENVIRONMENTAL INDICATORS


Energy

     
last update: December 2010
 

Energy Consumption, Energy Use Intensity and Renewable Electricity Production in 2007


Commercial
energy
consumption
Commercial
energy
consumption
per capita
 

Energy use
intensity per
$1,000 (PPP)
GDP

Renewable
electricity
production
           
 
1000 t oil eq.
 
kg oil eq.
 
kg oil eq.
 
%
 
Afghanistan
 
284
11
...
60.96
Albania  
1 525
482
108
97.48
Algeria  
36 537
1 072
149
0.61
Andorra  
227
2 756
...
75.00
Angola  
3 739
305
124
81.46
Anguilla  
19
1 313
...
0.00
Antigua and Barbuda  
146
1 716
...
0.00
Argentina  
70 180
1 783
148
27.48
Armenia  
2 517
781
176
31.50
Aruba  
246
2 366
...
0.00
Australia  
118 998
5 706
166
6.87
Austria  
27 729
3 335
113
63.96
Azerbaijan  
12 012
1 400
188
10.82
Bahamas  
709
2 124
...
0.00
Bahrain  
9 489
12 483
373
0.00
Bangladesh  
25 319
176
139
5.71
Barbados  
406
1 481
...
0.00
Belarus  
25 955
2 679
281
0.11
Belgium  
41 966
3 951
160
2.46
Belize  
178
605
...
81.73
Benin  
1 095
121
257
0.76
Bermuda  
170
2 662
...
0.00
Bhutan  
244
360
...
99.97
Bolivia  
4 400
448
151
39.98
Bosnia and Herzegovina  
8 054
2 096
223
33.84
Botswana  
1 596
919
86
0.00
Brazil  
159 078
837
135
84.13
British Virgin Islands  
33
1 442
...
0.00
Brunei Darussalam  
3 543
9 085
150
0.00
Bulgaria  
16 097
2 107
266
7.58
Burkina Faso  
565
38
...
18.14
Burundi  
72
9
...
98.32
Cambodia  
1 494
104
209
3.71
Cameroon  
2 321
124
196
66.87
Canada  
241 300
7 324
225
58.08
Cape Verde  
103
209
...
2.60
Cayman Islands  
178
3 293
...
0.00
Central African Republic  
96
22
...
81.25
Chad  
67
6
...
0.00
Chile  
25 142
1 515
142
39.55
China  
1 822 086
1 371
292
15.13
China, Hong Kong SAR  
12 339
1 782
50
0.00
China, Macao SAR  
655
1 246
...
0.00
Colombia  
22 246
468
81
80.44
Comoros  
42
58
...
9.43
Congo  
487
129
101
82.31
Cook Islands  
23
1 067
...
0.00
Costa Rica  
3 173
712
104
91.16
Cote d'Ivoire  
2 166
107
325
31.91
Croatia  
9 465
2 107
133
36.22
Cuba  
8 861
791
...
0.69
Cyprus  
2 353
2 755
129
0.04
Czech Republic  
40 092
3 862
194
3.00
Dem. Rep. of the Congo  
1 368
21
1 031
99.69
Denmark  
16 736
3 079
104
18.39
Djibouti  
143
171
...
0.00
Dominica  
52
718
...
35.29
Dominican Republic  
6 562
669
111
9.44
Ecuador  
10 066
754
126
57.92
Egypt  
68 164
926
176
12.75
El Salvador  
2 320
327
130
53.75
Equatorial Guinea  
1 759
3 469
...
2.11
Eritrea  
184
38
252
0.69
Estonia  
5 556
4 141
215
0.92
Ethiopia  
2 169
29
392
95.43
Faeroe Islands  
233
4 829
...
44.61
Falkland Islands (Malvinas)  
18
6 103
...
0.00
Fiji  
524
626
...
85.77
Finland  
26 633
5 047
208
17.69
France  
170 808
1
2 768
1
135
11.96
1
French Guiana  
284
1 408
...
0.00
French Polynesia  
296
1 139
...
32.46
Gabon  
753
530
97
43.44
Gambia  
133
81
...
0.00
Georgia  
2 983
680
173
81.82
Germany  
284 684
3 461
121
11.18
Ghana  
3 217
141
323
53.36
Gibraltar  
134
4 576
...
0.00
Greece  
32 566
2 910
107
8.18
Greenland  
235
4 152
...
0.00
Grenada  
81
758
...
0.00
Guadeloupe  
679
1 513
...
0.00
Guatemala  
4 063
304
143
41.46
Guinea  
446
48
...
52.39
Guinea-Bissau  
95
68
...
0.00
Guyana  
507
675
...
0.00
Haiti  
765
79
274
32.84
Honduras  
2 840
377
186
35.05
Hungary  
23 305
2 323
148
0.80
Iceland  
1 967
6 536
428
99.96
India  
436 736
385
203
14.83
Indonesia  
117 414
523
241
12.87
Iran (Islamic Republic of)  
179 289
2 491
252
8.56
Iraq  
30 627
1 032
...
1.52
Ireland  
14 988
3 485
84
10.54
Isle of Man  
-2
2
-29
2
...
0.43
2
Israel  
9 722
1 354
122
0.03
Italy  
179 549
3
3 028
3
104
15.33
3
Jamaica  
4 462
1 655
255
2.72
Japan  
423 593
3 359
127
7.93
Jordan  
7 227
1 263
260
0.50
Kazakhstan  
71 090
4 591
418
10.66
Kenya  
3 003
81
335
67.64
Kiribati  
11
105
...
0.00
Korea, Dem. People's Rep.  
19 016
799
...
61.70
Korea, Republic of  
161 179
3 310
183
1.28
Kuwait  
26 545
9 311
208
0.00
Kyrgyzstan  
2 905
550
293
85.90
Lao People's Dem. Rep.  
434
74
91.82
Latvia  
3 459
1 520
134
58.39
Lebanon  
4 445
1 182
95
5.16
Lesotho  
19
10
...
100.00
Liberia  
199
55
...
0.00
Libyan Arab Jamahiriya  
16 012
2 596
196
0.00
Lithuania  
7 832
2 320
173
7.60
Luxembourg  
4 340
9 041
119
25.09
Madagascar  
607
32
...
57.75
Malawi  
392
30
...
85.71
Malaysia  
73 009
2 687
214
6.40
Maldives  
299
992
...
0.00
Mali  
218
18
...
54.75
Malta  
889
2 189
102
0.00
Marshall Islands  
32
616
...
0.00
Martinique  
637
1 600
...
0.00
Mauritania  
581
189
...
0.00
Mauritius  
1 194
947
...
3.41
Mexico  
160 848
1 496
132
13.58
Mongolia  
2 907
1 112
387
0.00
Montenegro  
869
1 390
...
59.89
Montserrat  
26
5 433
...
0.00
Morocco  
13 082
419
120
7.04
Mozambique  
1 841
90
564
99.92
Myanmar  
5 514
112
...
53.93
Namibia  
1 289
617
127
92.33
Nauru  
47
3 506
...
0.00
Nepal  
1 257
44
343
99.64
Netherlands  
64 807
3 956
131
3.47
Netherlands Antilles  
2 003
10 432
...
0.00
New Caledonia  
906
3 728
...
22.17
New Zealand  
14 217
3 363
155
64.29
Nicaragua  
1 456
260
255
17.08
Niger  
292
21
...
0.00
Nigeria  
18 107
123
386
27.88
Niue  
1
751
...
0.00
Norway  
28 608
4
6 075
4
116
98.86
4
Occupied Palestinian Territory  
1 058
281
...
0.00
Oman  
15 415
5 655
265
0.00
Pakistan  
59 002
370
218
30.01
Palau  
71
3 340
...
11.69
Panama  
2 345
702
79
56.61
Papua New Guinea  
1 158
180
...
28.73
Paraguay  
2 025
331
164
100.00
Peru  
11 941
436
68
65.32
Philippines  
24 307
274
142
31.61
Poland  
92 349
2 422
163
2.17
Portugal  
19 773
1 864
111
31.13
Puerto Rico  
712
181
...
1.26
Qatar  
22 058
17 989
291
5
0.00
Republic of Moldova  
2 017
564
364
3.00
Réunion  
847
1 051
...
36.72
Romania  
33 392
1 550
179
25.89
Russian Federation  
626 854
4 411
340
17.68
Rwanda  
179
19
...
20.12
Saint Helena  
4
543
...
0.00
Saint Kitts and Nevis  
83
1 820
...
0.00
Saint Lucia  
128
756
...
0.00
Saint Pierre and Miquelon  
22
3 193
...
0.00
Samoa  
58
312
...
44.92
Sao Tome and Principe  
44
278
...
23.26
Saudi Arabia  
142 582
5 777
288
0.00
Senegal  
1 069
90
137
0.00
Serbia  
15 149
1 449
225
27.48
Seychelles  
205
2 416
...
0.00
Sierra Leone  
309
57
...
30.00
Singapore  
15 423
3439
123
0.00
Slovakia  
14 826
2 747
171
16.48
Slovenia  
5 521
2 746
138
21.71
Solomon Islands  
64
129
...
0.00
Somalia  
194
22
...
4.60
South Africa  
122 775
2 538
304
1.50
Spain  
126 242
2 813
113
19.21
Sri Lanka  
4 126
208
116
40.25
St. Vincent and the Grenadines  
70
674
...
24.82
Sudan  
3 782
98
193
31.95
Suriname  
714
1 401
...
53.83
Swaziland  
423
444
...
38.11
Sweden  
26 274
2 869
162
45.46
Switzerland  
18 420
6
2 439
6
91
54.13
6
Syrian Arab Republic  
19 615
1 023
237
9.11
Tajikistan  
3 968
589
349
97.83
Thailand  
82 385
1 230
212
5.66
The Former Yugoslav Rep. of Macedonia  
3 327
1 628
188
15.01
Timor-Leste  
61
58
...
0.00
Togo  
359
66
502
46.94
Tonga  
58
564
...
0.00
Trinidad and Tobago  
16 028
12 024
510
0.00
Tunisia  
7 825
765
122
0.65
Turkey  
92 654
1 254
114
18.98
Turkmenistan  
18 767
3 780
643
0.02
Turks and Caicos Islands  
52
1 485
...
0.00
Uganda  
1 064
38
...
72.34
Ukraine  
120 425
2 602
451
5.25
United Arab Emirates  
56 505
12 901
222
0.00
United Kingdom  
204 669
3 357
101
3.59
United Rep. of Tanzania  
2 118
54
396
60.14
United States  
2 121 106
6 872
180
7.55
Uruguay  
2 562
767
88
85.60
Uzbekistan  
52 378
1 914
791
13.07
Vanuatu  
26
115
...
0.00
Venezuela (Bolivarian Republic of)  
65 535
2 385
202
72.32
Viet Nam  
32 460
381
267
43.01
Wallis and Futuna Islands  
9
538
...
0.00
Western Sahara  
79
164
...
0.00
Yemen  
5 663
263
147
0.00
Zambia  
1 370
113
499
99.42
Zimbabwe  
3 413
256
4 197
7
56.79


Sources:

UNSD Energy Statistics Yearbook.
UNSD Millennium Development Goals Indicators database (see http://mdgs.un.org/unsd/mdg/Data.aspx).


Footnotes:

  1. Includes Monaco.
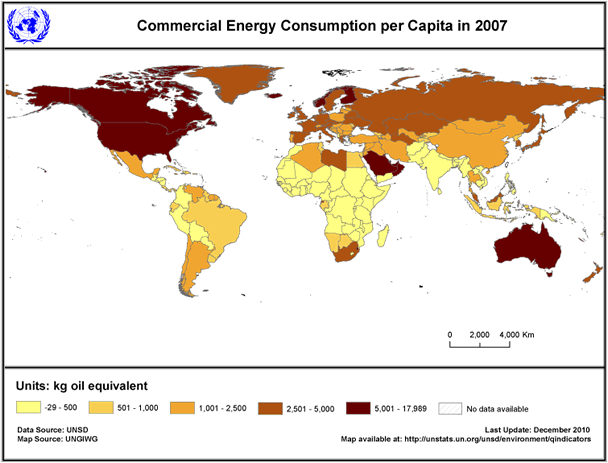
  2. Commercial energy consumption is equal to electricity consumption. Negative consumption is due to negligible or no primary electricity production and/or net export.
  3. Includes San Marino.
  4. Includes Svalbard and Jan Mayen.
  5. 2006 data.
  6. Refers to Switzerland and Liechtenstein.
  7. 2005 data.

Definitions & Technical notes:

The data on energy consumption and renewable electricity production were compiled by the UNSD Energy Statistics Section for the Energy Statistics Yearbook. For more detailed information on these and other energy consumption and production indicators please refer to the publication.

Energy use intensity data were compiled for the Millennium Development Goals Database by the World Bank Data Development Group using GDP in constant 2005 PPP $. Energy use refers to use of primary energy before transformation to other end-use fuels, which is equal to indigenous production plus imports and stock changes, minus exports and fuels supplied to ships and aircraft engaged in international transport. For more detailed information see the UNSD Millennium Development Goals Metadata page (http://mdgs.un.org/unsd/mdg/Metadata.aspx).

Data on consumption refer to "apparent consumption" and are derived from the formula "production + imports - exports - bunkers +/- stock changes." Accordingly, the series on apparent consumption may occasionally represent only an indication of the magnitude of actual (i.e., "measured") gross inland availability. This statement is particularly suitable either when stock data are unavailable or unreliable, or when apparent consumption is a small residual element derived from calculations between large aggregate series and thus is sensitive to small variations in these series. This latter point is also appropriate with respect to the per capita consumption calculations. Where the quantities involved are small, the series tend to exaggerate the effects of such elements as stock additions or withdrawals.

The data on production refer to the first stage of production: accordingly, for electricity, to the gross production of generating plants. This includes the consumption by station auxiliaries and any losses in the transformers that are considered integral parts of the station. Included also is total electric energy produced by pumping installations without deduction of electric energy absorbed by pumping. Production from renewable sources was calculated from the sum of two categories in the Energy Statistics Yearbook: Hydro and Geothermal. Geothermal includes Solar, Tide, Wave, and Wind, when reported. Any electricity production from burning is classified as Thermal; therefore production from burning wastes or fuel wood is not included as a renewable source in this table. However, given available data, burning of wastes and fuel wood has been observed to be a relatively negligible proportion of electricity production in most cases.

Data Quality:

Energy consumption and renewable electricity production data are compiled primarily from the UNSD Annual Questionnaire on Energy Statistics and supplemented with data from official national statistical publications and specialized and intergovernmental agencies. Where official data are not available, estimates are made by UNSD based on governmental, professional or commercial materials. Estimates include, but are not limited to, extrapolated data based on partial year information, use of annual trends, trade data based on partner country reports, breakdowns of aggregated data as well as analysis of current energy events and activities. For more information visit: http://unstats.un.org/unsd/energy/yearbook/default.htm.

Energy use intensity data are collected and disseminated by the International Energy Agency (IEA) of the Organization for Economic Co-operation and Development (OECD). The Energy Statistics Division of the IEA collects, processes, and publishes data and information on energy production, trade, stocks, transformation, consumption, prices and taxes as well as on greenhouse gas emissions. The geographical coverage of the IEA's statistics includes the 30 OECD Member countries and over 100 non-OECD countries worldwide. The data are originally collected by official bodies (often national statistical offices) in OECD Member countries from firms, government agencies and industry organisations, etc., to meet national needs and are then reported to the IEA using special questionnaires to ensure international comparability. Data are also collected for non-OECD countries directly from government and industry contacts and from national publications. The World Bank obtains data on energy use from the IEA electronically, and computes the energy use per GDP (constant 2005 PPP $) series. The World Bank does not make any estimation for missing values of energy use data.

GDP (constant 2005 PPP $) data are based on country reported GDP data adjusted by the World Bank to allow for international comparisons. Conversion to international dollars is done using PPP estimates produced by the World Bank and International Comparison Program (ICP). GDP PPP estimates for countries that did not participate in the 2005 ICP round are estimated. Further details regarding estimation methods are available in the metadata for PPP conversion factors, or in Global Purchasing Power Parities and Real Expenditures: 2005 International Comparison Program, available at http://www.worldbank.org/data/icp.


United Nations Statistics Division - Environment Statistics