| |
|
|
|
|
|
|
|
|
|
|
|
|
|
|
ENVIRONMENTAL INDICATORS |
|
|
|
|
|
|
|
|
|
|
|
| |
|
|
|
|
|
|
|
|
|
|
|
|
|
|
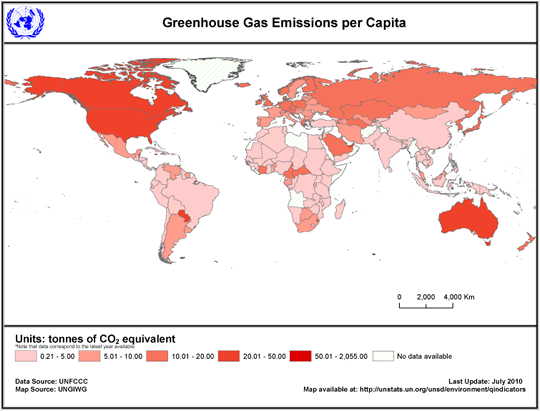
Climate Change |
|
|
|
|
last update: July 2010 |
|
| |
|
|
|
|
|
|
|
|
|
|
|
|
|
|
Greenhouse gas emissions by sector (absolute values)  |
| |
|
|
|
|
|
|
|
|
|
|
|
|
|
|
|
| |
|
|
|
|
|
|
|
|
|
|
|
|
|
|
| |
|
latest
year available |
Total
GHG
emissions |
|
GHG from
Energy |
|
GHG from
Energy of
which: from
Transport |
|
GHG from
Industrial processes |
|
GHG from
Agriculture |
|
GHG from
Waste |
|
|
|
|
|
|
|
|
|
|
|
|
|
|
|
|
|
|
|
mio. tonnes
of CO2
equivalent |
|
mio. tonnes
of CO2
equivalent |
|
mio. tonnes
of CO2
equivalent |
|
mio. tonnes
of CO2
equivalent |
|
mio. tonnes
of CO2
equivalent |
|
mio. tonnes
of CO2
equivalent |
|
|
Albania |
1994 |
5.53 |
|
3.10 |
|
0.80 |
|
0.21 |
|
1.88 |
|
0.34 |
|
|
Algeria |
1994 |
91.76 |
|
70.06 |
|
13.95 |
|
4.77 |
|
12.21 |
|
4.72 |
|
|
Antigua and Barbuda |
1990 |
0.39 |
|
0.29 |
|
0.08 |
|
... |
|
0.02 |
|
0.08 |
|
|
Argentina |
2000 |
282.00 |
|
131.96 |
|
40.24 |
|
11.11 |
|
124.92 |
|
14.01 |
|
|
Armenia |
1990 |
25.31 |
|
23.11 |
|
3.64 |
|
0.63 |
|
1.04 |
|
0.54 |
|
|
Australia |
2008 |
549.54 |
|
416.60 |
|
80.21 |
|
31.14 |
|
87.39 |
|
14.40 |
|
|
Austria |
2008 |
86.64 |
|
64.73 |
|
22.53 |
|
11.87 |
|
7.63 |
|
2.02 |
|
|
Azerbaijan |
1994 |
43.17 |
|
4.51 |
|
... |
|
... |
|
3.68 |
|
1.76 |
|
|
Bahamas |
1994 |
2.20 |
|
1.87 |
|
... |
|
... |
|
0.02 |
|
... |
|
|
Bahrain |
1994 |
19.60 |
|
15.20 |
|
1.30 |
|
2.02 |
|
0.05 |
|
2.33 |
|
|
Bangladesh |
1994 |
45.93 |
|
15.21 |
|
2.54 |
|
1.28 |
|
28.12 |
|
1.31 |
|
|
Barbados |
1997 |
4.06 |
|
2.03 |
|
0.25 |
|
0.17 |
|
0.07 |
|
1.79 |
|
|
Belarus |
2008 |
91.11 |
|
58.70 |
|
6.37 |
|
3.97 |
|
22.75 |
|
5.63 |
|
|
Belgium |
2008 |
133.25 |
|
109.27 |
|
27.64 |
|
13.05 |
|
9.67 |
|
1.02 |
|
|
Belize |
1994 |
6.34 |
|
0.61 |
|
0.31 |
|
0.00 |
|
0.27 |
|
5.46 |
|
|
Benin |
1995 |
39.35 |
|
1.00 |
|
0.40 |
|
0.10 |
|
37.96 |
|
0.30 |
|
|
Bhutan |
1994 |
1.29 |
|
0.10 |
|
0.04 |
|
0.13 |
|
1.06 |
|
... |
|
|
Bolivia |
2004 |
43.67 |
|
9.03 |
|
4.27 |
|
21.27 |
|
11.66 |
|
1.70 |
|
|
Botswana |
1994 |
9.29 |
|
3.84 |
|
0.80 |
|
0.21 |
|
5.07 |
|
0.17 |
|
|
Brazil |
1994 |
663.25 |
|
247.59 |
|
95.12 |
|
25.72 |
|
369.25 |
|
20.68 |
|
|
Bulgaria |
2008 |
73.43 |
|
54.45 |
|
8.38 |
|
6.41 |
|
4.92 |
|
7.59 |
|
|
Burkina Faso |
1994 |
5.97 |
|
0.91 |
|
0.32 |
|
... |
|
4.71 |
|
0.35 |
|
|
Burundi |
1998 |
2.00 |
|
0.80 |
|
0.09 |
|
0.00 |
|
1.09 |
|
0.10 |
|
|
Cambodia |
1994 |
12.76 |
|
1.88 |
|
0.83 |
|
0.05 |
|
10.56 |
|
0.27 |
|
|
Cameroon |
1994 |
165.73 |
|
3.24 |
|
1.35 |
|
58.52 |
|
102.23 |
|
1.73 |
|
|
Canada |
2008 |
734.42 |
|
597.41 |
|
198.32 |
|
52.59 |
|
62.44 |
|
21.66 |
|
|
Cape Verde |
1995 |
0.29 |
|
0.22 |
|
0.00 |
|
... |
|
0.04 |
|
0.03 |
|
|
Central African Republic |
1994 |
37.74 |
|
18.93 |
|
0.12 |
|
... |
|
16.24 |
|
2.57 |
|
|
Chad |
1993 |
8.02 |
|
0.31 |
|
... |
|
... |
|
7.30 |
|
0.41 |
|
|
Chile |
1994 |
54.89 |
|
37.34 |
|
13.08 |
|
2.16 |
|
13.41 |
|
1.97 |
|
|
China |
1994 |
4 057.62 |
|
3 007.78 |
|
165.57 |
|
282.63 |
|
605.09 |
|
162.12 |
|
|
Colombia |
1994 |
137.48 |
|
62.25 |
|
19.22 |
|
5.30 |
|
61.45 |
|
8.48 |
|
|
Comoros |
1994 |
0.51 |
|
0.07 |
|
... |
|
... |
|
0.44 |
|
0.00 |
|
|
Congo |
2000 |
2.07 |
|
1.61 |
|
0.39 |
|
0.00 |
|
0.32 |
|
0.12 |
|
|
Cook Islands |
1994 |
0.08 |
|
0.03 |
|
0.02 |
|
... |
|
0.01 |
|
0.04 |
|
|
Costa Rica |
2005 |
12.11 |
|
5.69 |
|
3.89 |
|
0.50 |
|
4.60 |
|
1.32 |
|
|
Cote d'Ivoire |
2000 |
271.20 |
|
66.59 |
|
2.20 |
|
0.00 |
|
194.61 |
|
10.00 |
|
|
Croatia |
2008 |
31.13 |
|
22.47 |
|
6.24 |
|
4.13 |
|
3.35 |
|
0.93 |
|
|
Cuba |
1996 |
40.19 |
|
26.64 |
|
... |
|
1.22 |
|
10.27 |
|
2.06 |
|
|
Czech Republic |
2008 |
141.41 |
|
114.62 |
|
18.73 |
|
14.34 |
|
8.32 |
|
3.60 |
|
|
Dem. Rep. of the Congo |
2003 |
46.00 |
|
3.60 |
|
0.83 |
|
0.16 |
|
34.58 |
|
7.66 |
|
|
Denmark |
2008 |
65.13 |
|
51.62 |
|
14.22 |
|
2.08 |
|
10.07 |
|
1.27 |
|
|
Djibouti |
1994 |
0.51 |
|
0.27 |
|
0.13 |
|
... |
|
0.21 |
|
0.03 |
|
|
Dominica |
1994 |
0.15 |
|
0.08 |
|
0.04 |
|
... |
|
0.01 |
|
0.06 |
|
|
Dominican Republic |
2000 |
26.43 |
|
18.25 |
|
6.18 |
|
0.81 |
|
5.70 |
|
1.67 |
|
|
Ecuador |
1990 |
30.77 |
|
19.89 |
|
9.08 |
|
1.15 |
|
8.39 |
|
1.34 |
|
|
Egypt |
1990 |
116.74 |
|
82.76 |
|
21.16 |
|
10.28 |
|
18.01 |
|
5.69 |
|
|
El Salvador |
1994 |
11.72 |
|
4.57 |
|
1.82 |
|
0.49 |
|
5.78 |
|
0.88 |
|
|
Eritrea |
2000 |
0.76 |
|
0.60 |
|
0.20 |
|
... |
|
... |
|
0.15 |
|
|
Estonia |
2008 |
20.25 |
|
17.09 |
|
2.32 |
|
1.04 |
|
1.45 |
|
0.67 |
|
|
Ethiopia |
1995 |
47.75 |
|
7.57 |
|
... |
|
0.34 |
|
38.50 |
|
1.34 |
|
|
Fiji |
1994 |
1.39 |
|
0.78 |
|
0.53 |
|
0.05 |
|
0.49 |
|
0.08 |
|
|
Finland |
2008 |
70.13 |
|
54.97 |
|
13.63 |
|
7.03 |
|
5.83 |
|
2.20 |
|
|
France |
2008 |
531.80 |
|
380.62 |
|
132.22 |
|
40.85 |
|
98.60 |
|
10.45 |
|
|
Gabon |
1994 |
6.52 |
|
6.36 |
|
0.55 |
|
0.07 |
|
... |
|
0.09 |
|
|
Gambia |
1993 |
4.26 |
|
0.25 |
|
0.11 |
|
... |
|
0.89 |
|
3.11 |
|
|
Georgia |
2006 |
12.22 |
|
5.97 |
|
1.29 |
|
1.78 |
|
3.31 |
|
1.15 |
|
|
Germany |
2008 |
958.06 |
|
772.79 |
|
153.48 |
|
104.83 |
|
66.20 |
|
10.86 |
|
|
Ghana |
1996 |
13.14 |
|
7.06 |
|
... |
|
0.27 |
|
5.29 |
|
0.52 |
|
|
Greece |
2008 |
126.89 |
|
104.03 |
|
22.69 |
|
10.66 |
|
8.92 |
|
2.97 |
|
|
Grenada |
1994 |
1.61 |
|
0.14 |
|
0.05 |
|
... |
|
0.00 |
|
1.47 |
|
|
Guatemala |
1990 |
14.74 |
|
4.58 |
|
2.13 |
|
0.54 |
|
8.83 |
|
0.78 |
|
|
Guinea |
1994 |
5.06 |
|
2.04 |
|
0.63 |
|
0.14 |
|
2.53 |
|
0.34 |
|
|
Guinea-Bissau |
1994 |
1.69 |
|
0.18 |
|
0.00 |
|
0.00 |
|
1.47 |
|
0.04 |
|
|
Guyana |
1998 |
3.07 |
|
1.77 |
|
0.30 |
|
... |
|
1.28 |
|
0.02 |
|
|
Haiti |
1994 |
5.10 |
|
0.42 |
|
0.10 |
|
... |
|
4.09 |
|
0.40 |
|
|
Honduras |
1995 |
10.83 |
|
3.99 |
|
2.27 |
|
0.51 |
|
3.38 |
|
2.94 |
|
|
Hungary |
2008 |
73.14 |
|
55.48 |
|
12.89 |
|
4.75 |
|
8.78 |
|
3.73 |
|
|
Iceland |
2008 |
4.88 |
|
2.09 |
|
0.97 |
|
1.99 |
|
0.57 |
|
0.22 |
|
|
India |
1994 |
1 214.25 |
|
743.82 |
|
80.29 |
|
102.71 |
|
344.49 |
|
23.23 |
|
|
Indonesia |
1994 |
334.19 |
|
222.10 |
|
47.34 |
|
19.14 |
|
84.51 |
|
8.44 |
|
|
Iran (Islamic Republic of) |
1994 |
385.43 |
|
321.36 |
|
60.61 |
|
25.47 |
|
30.30 |
|
8.30 |
|
|
Ireland |
2008 |
67.44 |
|
45.69 |
|
14.25 |
|
2.99 |
|
17.58 |
|
1.09 |
|
|
Israel |
2005 |
73.41 |
|
63.02 |
|
14.21 |
|
2.29 |
|
3.18 |
|
4.92 |
|
|
Italy |
2008 |
541.49 |
|
452.91 |
|
123.88 |
|
34.10 |
|
35.87 |
|
16.61 |
|
|
Jamaica |
1994 |
116.31 |
|
8.23 |
|
1.27 |
|
0.38 |
|
107.32 |
|
0.38 |
|
|
Japan |
2008 |
1 281.82 |
|
1 160.46 |
|
230.94 |
|
75.31 |
|
25.84 |
|
20.05 |
|
|
Jordan |
2000 |
19.40 |
|
14.91 |
|
3.62 |
|
1.59 |
|
0.18 |
|
2.71 |
|
|
Kazakhstan |
2008 |
245.86 |
|
214.45 |
|
24.25 |
|
14.45 |
|
12.10 |
|
4.86 |
|
|
Kenya |
1994 |
21.47 |
|
8.06 |
|
... |
|
0.99 |
|
12.10 |
|
0.32 |
|
|
Kiribati |
1994 |
0.03 |
|
0.02 |
|
... |
|
... |
|
0.00 |
|
0.01 |
|
|
Korea, Dem. People's Rep. |
1990 |
201.92 |
|
178.95 |
|
3.51 |
|
9.86 |
|
11.64 |
|
1.48 |
|
|
Korea, Republic of |
2001 |
542.89 |
|
453.17 |
|
89.68 |
|
57.84 |
|
16.12 |
|
15.76 |
|
|
Kyrgyzstan |
2005 |
12.02 |
|
8.90 |
|
2.49 |
|
0.52 |
|
1.94 |
|
0.66 |
|
|
Lao People's Dem. Rep. |
1990 |
6.87 |
|
0.93 |
|
... |
|
... |
|
5.70 |
|
0.24 |
|
|
Latvia |
2008 |
11.90 |
|
8.51 |
|
3.60 |
|
0.34 |
|
2.08 |
|
0.92 |
|
|
Lebanon |
1994 |
15.70 |
|
11.78 |
|
3.99 |
|
1.92 |
|
1.10 |
|
0.90 |
|
|
Lesotho |
1994 |
1.82 |
|
0.83 |
|
0.22 |
|
... |
|
0.94 |
|
0.05 |
|
|
Liechtenstein |
2008 |
0.26 |
|
0.23 |
|
0.09 |
|
0.01 |
|
0.02 |
|
0.00 |
|
|
Lithuania |
2008 |
24.33 |
|
13.21 |
|
5.18 |
|
4.87 |
|
5.01 |
|
1.14 |
|
|
Luxembourg |
2008 |
12.49 |
|
11.00 |
|
6.67 |
|
0.74 |
|
0.67 |
|
0.07 |
|
|
Madagascar |
1994 |
21.93 |
|
1.92 |
|
0.62 |
|
0.01 |
|
19.79 |
|
0.21 |
|
|
Malawi |
1994 |
7.07 |
|
3.72 |
|
... |
|
0.06 |
|
3.20 |
|
0.09 |
|
|
Malaysia |
1994 |
136.68 |
|
97.86 |
|
... |
|
4.97 |
|
6.93 |
|
26.91 |
|
|
Maldives |
1994 |
0.15 |
|
0.13 |
|
... |
|
... |
|
... |
|
0.02 |
|
|
Mali |
1995 |
8.67 |
|
0.97 |
|
... |
|
0.01 |
|
7.57 |
|
0.12 |
|
|
Malta |
2008 |
2.95 |
|
2.66 |
|
0.52 |
|
0.03 |
|
0.08 |
|
0.18 |
|
|
Mauritania |
2000 |
6.94 |
|
1.17 |
|
0.41 |
|
0.02 |
|
5.67 |
|
0.09 |
|
|
Mauritius |
1995 |
2.06 |
|
1.76 |
|
0.65 |
|
0.09 |
|
0.14 |
|
0.07 |
|
|
Mexico |
2002 |
553.33 |
|
389.50 |
|
114.39 |
|
52.10 |
|
46.15 |
|
65.58 |
|
|
Micronesia, Federated States of |
1994 |
0.25 |
|
0.24 |
|
0.00 |
|
0.00 |
|
0.00 |
|
0.00 |
|
|
Monaco |
2008 |
0.10 |
|
0.09 |
|
0.03 |
|
0.00 |
|
... |
|
0.00 |
|
|
Mongolia |
1998 |
15.93 |
|
9.40 |
|
2.12 |
|
0.10 |
|
6.34 |
|
0.09 |
|
|
Morocco |
1994 |
44.39 |
|
26.86 |
|
5.84 |
|
3.16 |
|
12.09 |
|
2.28 |
|
|
Mozambique |
1994 |
8.22 |
|
1.86 |
|
0.85 |
|
0.05 |
|
4.62 |
|
1.69 |
|
|
Namibia |
1994 |
5.60 |
|
1.92 |
|
0.91 |
|
0.01 |
|
3.61 |
|
0.07 |
|
|
Nauru |
1994 |
0.04 |
|
0.03 |
|
... |
|
... |
|
0.00 |
|
0.00 |
|
|
Nepal |
1994 |
31.19 |
|
3.27 |
|
0.46 |
|
0.17 |
|
27.20 |
|
0.56 |
|
|
Netherlands |
2008 |
206.91 |
|
172.06 |
|
35.98 |
|
10.48 |
|
18.52 |
|
5.65 |
|
|
New Zealand |
2008 |
74.66 |
|
33.84 |
|
14.27 |
|
4.29 |
|
34.83 |
|
1.67 |
|
|
Nicaragua |
1994 |
7.65 |
|
2.69 |
|
0.84 |
|
0.35 |
|
4.27 |
|
0.34 |
|
|
Niger |
2000 |
13.63 |
|
2.62 |
|
0.76 |
|
0.02 |
|
10.64 |
|
0.35 |
|
|
Nigeria |
1994 |
242.63 |
|
146.36 |
|
36.86 |
|
1.76 |
|
50.50 |
|
44.00 |
|
|
Niue |
1994 |
4.42 |
|
4.42 |
|
1.42 |
|
... |
|
0.00 |
|
0.00 |
|
|
Norway |
2008 |
53.71 |
|
39.03 |
|
15.30 |
|
8.92 |
|
4.36 |
|
1.22 |
|
|
Pakistan |
1994 |
160.59 |
|
83.26 |
|
18.68 |
|
11.27 |
|
61.94 |
|
4.12 |
|
|
Palau |
2000 |
0.09 |
|
... |
|
... |
|
0.00 |
|
0.09 |
|
... |
|
|
Panama |
1994 |
10.69 |
|
3.90 |
|
1.49 |
|
0.41 |
|
4.73 |
|
1.65 |
|
|
Papua New Guinea |
1994 |
5.01 |
|
0.95 |
|
... |
|
0.19 |
|
3.87 |
|
... |
|
|
Paraguay |
1994 |
140.46 |
|
3.26 |
|
2.73 |
|
0.73 |
|
136.30 |
|
0.16 |
|
|
Peru |
1994 |
57.58 |
|
22.15 |
|
7.97 |
|
9.90 |
|
22.81 |
|
2.72 |
|
|
Philippines |
1994 |
100.87 |
|
50.04 |
|
15.89 |
|
10.60 |
|
33.13 |
|
7.09 |
|
|
Poland |
2008 |
395.56 |
|
315.47 |
|
42.70 |
|
33.32 |
|
37.11 |
|
8.91 |
|
|
Portugal |
2008 |
78.38 |
|
55.48 |
|
19.29 |
|
6.92 |
|
7.84 |
|
7.88 |
|
|
Republic of Moldova |
2005 |
11.88 |
|
7.72 |
|
1.65 |
|
0.58 |
|
2.13 |
|
1.40 |
|
|
Romania |
2008 |
145.92 |
|
100.14 |
|
14.68 |
|
18.74 |
|
20.29 |
|
6.62 |
|
|
Russian Federation |
2008 |
2 229.57 |
|
1 833.14 |
|
217.86 |
|
181.14 |
|
144.09 |
|
70.66 |
|
|
Rwanda |
2002 |
2.38 |
|
1.15 |
|
... |
|
0.05 |
|
0.96 |
|
0.22 |
|
|
Saint Kitts and Nevis |
1994 |
0.16 |
|
0.07 |
|
0.03 |
|
... |
|
0.04 |
|
0.05 |
|
|
Saint Lucia |
1994 |
0.89 |
|
0.27 |
|
0.11 |
|
... |
|
0.03 |
|
0.59 |
|
|
Samoa |
1994 |
0.56 |
|
0.10 |
|
0.07 |
|
... |
|
0.43 |
|
0.03 |
|
|
San Marino |
2007 |
0.24 |
|
0.23 |
|
0.14 |
|
... |
|
0.00 |
|
... |
|
|
Sao Tome and Principe |
1998 |
0.12 |
|
0.10 |
|
0.03 |
|
... |
|
0.01 |
|
0.01 |
|
|
Saudi Arabia |
1990 |
165.27 |
|
129.50 |
|
40.18 |
|
11.08 |
|
11.35 |
|
13.33 |
|
|
Senegal |
1995 |
9.57 |
|
3.92 |
|
1.28 |
|
0.38 |
|
3.00 |
|
2.28 |
|
|
Seychelles |
1995 |
0.26 |
|
0.18 |
|
0.06 |
|
... |
|
0.03 |
|
0.05 |
|
|
Singapore |
1994 |
26.86 |
|
26.65 |
|
4.10 |
|
... |
|
... |
|
0.21 |
|
|
Slovakia |
2008 |
48.83 |
|
32.13 |
|
6.72 |
|
11.14 |
|
3.10 |
|
2.38 |
|
|
Slovenia |
2008 |
21.28 |
|
17.47 |
|
6.16 |
|
1.19 |
|
1.98 |
|
0.62 |
|
|
Solomon Islands |
1994 |
0.29 |
|
0.29 |
|
0.19 |
|
... |
|
... |
|
... |
|
|
South Africa |
1994 |
379.84 |
|
297.57 |
|
43.52 |
|
30.39 |
|
35.46 |
|
16.43 |
|
|
Spain |
2008 |
405.74 |
|
318.35 |
|
103.51 |
|
31.34 |
|
38.96 |
|
15.57 |
|
|
Sri Lanka |
1995 |
29.13 |
|
6.77 |
|
3.17 |
|
0.27 |
|
11.46 |
|
10.62 |
|
|
St. Vincent and the Grenadines |
1997 |
0.41 |
|
0.11 |
|
0.04 |
|
... |
|
0.26 |
|
0.04 |
|
|
Sudan |
1995 |
54.19 |
|
7.77 |
|
1.92 |
|
0.17 |
|
45.25 |
|
1.00 |
|
|
Suriname |
2003 |
3.33 |
|
2.40 |
|
0.35 |
|
0.07 |
|
0.84 |
|
0.02 |
|
|
Swaziland |
1994 |
7.54 |
|
1.06 |
|
0.44 |
|
4.90 |
|
1.23 |
|
0.35 |
|
|
Sweden |
2008 |
63.96 |
|
46.68 |
|
20.69 |
|
6.79 |
|
8.47 |
|
1.74 |
|
|
Switzerland |
2008 |
53.22 |
|
43.36 |
|
16.59 |
|
3.31 |
|
5.68 |
|
0.65 |
|
|
Tajikistan |
2003 |
7.50 |
|
2.29 |
|
0.30 |
|
0.63 |
|
4.12 |
|
0.46 |
|
|
Thailand |
1994 |
223.99 |
|
129.87 |
|
39.92 |
|
15.98 |
|
77.41 |
|
0.74 |
|
|
The Former Yugoslav Rep. of Macedonia |
2002 |
12.23 |
|
9.62 |
|
1.08 |
|
0.70 |
|
1.07 |
|
0.84 |
|
|
Togo |
1998 |
6.28 |
|
1.45 |
|
... |
|
0.36 |
|
4.47 |
|
0.01 |
|
|
Tonga |
1994 |
0.23 |
|
0.08 |
|
0.05 |
|
... |
|
0.06 |
|
0.09 |
|
|
Trinidad and Tobago |
1990 |
16.01 |
|
9.93 |
|
1.49 |
|
5.12 |
|
0.34 |
|
0.62 |
|
|
Tunisia |
1994 |
25.14 |
|
15.25 |
|
3.41 |
|
2.84 |
|
6.02 |
|
1.03 |
|
|
Turkey |
2008 |
366.50 |
|
277.71 |
|
47.80 |
|
29.83 |
|
25.04 |
|
33.92 |
|
|
Turkmenistan |
1994 |
52.31 |
|
48.92 |
|
2.92 |
|
0.84 |
|
2.33 |
|
0.22 |
|
|
Tuvalu |
1994 |
0.01 |
|
0.00 |
|
... |
|
... |
|
0.00 |
|
... |
|
|
Uganda |
1994 |
41.55 |
|
3.91 |
|
0.68 |
|
0.04 |
|
37.50 |
|
0.10 |
|
|
Ukraine |
2008 |
427.80 |
|
292.64 |
|
44.31 |
|
90.57 |
|
34.64 |
|
9.62 |
|
|
United Arab Emirates |
2000 |
129.83 |
|
116.39 |
|
17.67 |
|
6.47 |
|
4.35 |
|
2.63 |
|
|
United Kingdom |
2008 |
631.73 |
|
536.28 |
|
129.44 |
|
28.85 |
|
43.83 |
|
22.82 |
|
|
United Rep. of Tanzania |
1994 |
39.24 |
|
6.89 |
|
1.67 |
|
0.37 |
|
29.73 |
|
2.25 |
|
|
United States |
2008 |
6 924.56 |
|
5 999.05 |
|
1 787.67 |
|
334.46 |
|
427.53 |
|
159.13 |
|
|
Uruguay |
2000 |
29.73 |
|
5.18 |
|
2.53 |
|
1.11 |
|
22.02 |
|
1.43 |
|
|
Uzbekistan |
2005 |
199.84 |
|
172.34 |
|
9.63 |
|
6.37 |
|
16.44 |
|
4.69 |
|
|
Vanuatu |
1994 |
0.30 |
|
0.06 |
|
0.05 |
|
... |
|
0.24 |
|
... |
|
|
Venezuela (Bolivarian Republic of) |
1999 |
192.19 |
|
143.56 |
|
33.99 |
|
9.21 |
|
32.96 |
|
6.47 |
|
|
Viet Nam |
1994 |
84.45 |
|
25.63 |
|
3.66 |
|
3.81 |
|
52.45 |
|
2.57 |
|
|
Yemen |
1995 |
17.87 |
|
10.13 |
|
3.85 |
|
0.55 |
|
6.30 |
|
0.89 |
|
|
Zambia |
1994 |
32.77 |
|
17.41 |
|
1.22 |
|
0.33 |
|
13.62 |
|
... |
|
|
Zimbabwe |
1994 |
27.59 |
|
16.76 |
|
2.05 |
|
4.59 |
|
... |
|
... |
|
| |
| |
| Sources: |
| UN Framework Convention on Climate Change (UNFCCC) Secretariat (see: http://unfccc.int). |
| Definitions & Technical notes: |
| GHG from Energy: all emissions related to the production and use of energy in any sectors of the economy and households. It includes emissions from fuel combustion as well as fugitive fuels. This variable corresponds to IPCC category 1. |
| GHG from Energy, of which: from Transport: emissions from the combustion and evaporation of fuel for all transport activity, regardless of the sector, specified by subsectors as civil aviation, road transportation, railways, navigation and other transportation. This variable corresponds to IPCC category 1A3. |
| GHG from Industrial Processes: emissions from processes such as chemical industry, metal industry, production and use of mineral products and other industries. This variable corresponds to IPCC category 2. |
| GHG from Agriculture: all emissions from enteric fermentation, manure management, rice cultivation, agricultural soils, field burning of agricultural residues, prescribed burning of savannas and other agricultural activities. This variable corresponds to IPCC category 4. |
| GHG from Waste: total emissions from solid waste disposal on land, wastewater handling, waste incineration and any other waste management activity. This variable corresponds to IPCC category 6. |
| For some non-Annex I countries, the GHG emissions data may be incomplete because they include only emissions from a few available sources and therefore do not represent the absolute total emissions of the country. For detailed information on emissions data and their completeness, please check the official submissions of GHG emissions/removals data by countries to the Climate Change Convention (http://unfccc.int/ghg_data/ghg_data_unfccc/data_sources/items/3816.php). |
| Data Quality: |
| Countries report their greenhouse gas emissions to UNFCCC according to the IPCC Guidelines. The quality of data is regularly checked through the UNFCCC review process for the Annex I Parties to the Convention that report the data annually. Non-Annex I countries do not report the data annually and their data are not subject to the same review procedures. Data quality depends on the quality of statistics underlying the calculations or estimates and is usually the best for energy related emissions; because of differences in completeness and quality of the estimates, the data should be used with caution when comparing countries. |
| |
|
|
|
|
|
|
|
|
|
|
|
|
|
|
| |