|
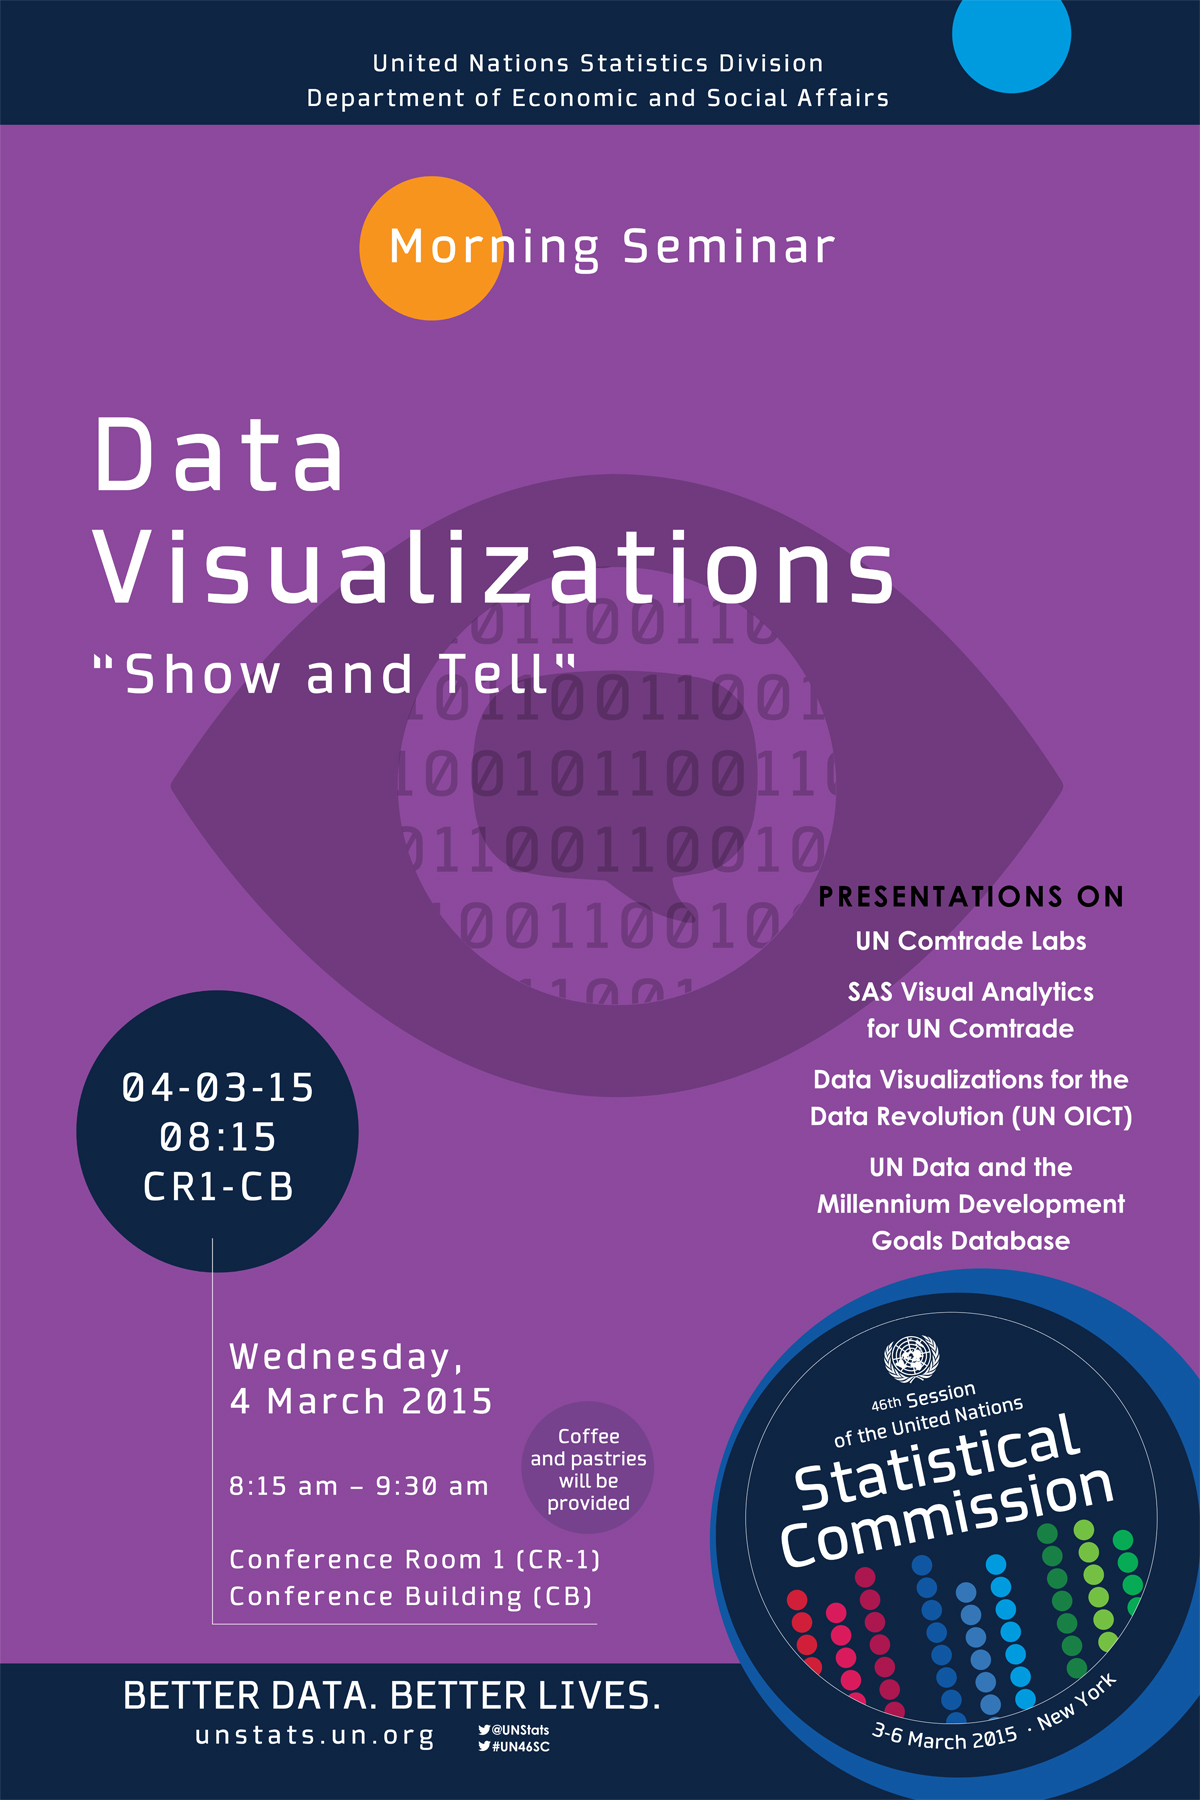
4 March 2015
 |
Wednesday Morning Seminar on
Data Visualizations:
Show and Tell
|
New cutting-edge authoring tools, data visualization designs and techniques, and the use of Internet in recent years have made it possible to visualize huge volume of data and metadata in an interactive way to wider audiences. Graphs, tables, illustrations, pictures are no longer static and are intended only for aesthetic of web pages or printed publication, but, now, they can serve as data exploration tools and visual narrative for storytelling. Furthermore, visualizing big data is no longer a possibility, but it is a reality.
Whereas traditional data visualization consists of visual methods on low volume of data such as line graphs, bar graphs, pie charts, etc., advanced data visualization enables creation and development of new graphics such as treemap, world cloud, chord diagram, dendrogram, motion charts, etc. that have many times the data density or complexity.
This morning seminar will focus on examples of data visualization initiatives on international trade statistics and other statistical domains including MDGs and an attempt to visualize data revolution.
The seminar is open and time will be made available for questions and answers.
United Nations Statistics Division (UNSD)
|
| |
| Presentations on |
| |
 |
UN Comtrade Labs, presentation 
by Mr. Ronald Jansen, Chief of Trade Statistics Branch, United Nations Statistics Division |
|
SAS Visual Analytics for UN Comtrade, presentation
by Mr. I-Sah Hsieh, Global Manager, International Development, SAS Institute, Inc. |
|
Data Visualizations for the Data Revolution, presentation
by Mr. Lambert Hogenhout, Chief Analytics, Partnerships and Innovation, UN OICT |
|
UN Data and the Millennium Development Goals Database, presentation
by Mr. Abdulla Gozalov, Chief of Global Data Services Unit, United Nations Statistics Division |
| |
| |
|
|