Sources:
UNSD/UNEP Questionnaires on Environment Statistics, Water section.
Eurostat environment statistics main tables and database (http://epp.eurostat.ec.europa.eu/portal/page/portal/environment/introduction).
OECD Environmental Data Compendium, Inland Waters section.
United Nations, Department of Economic and Social Affairs, Population Division, World Population Prospects: The 2008 Revision, New York, 2009 (advanced Excel tables).
Footnotes:
- Data referring to distributed water in Water Account Australia 2004-2005; exclude in-stream and reused water.
- Population connected to public water supply.
- Data refer to use of water from public water supply.
- This is % provided with the piped water to top up the rainwater tanks. Water is trucked to the remaining households to top up the rainwater tanks.
- Data refers to water consumption billed by Drinking Water Supply and Sewage Water Industry (EPSAS) from the capital cities, except from Cobija. Water lost during transportation is not included.
- Data source: Household survey; information refers to and covers water supply distribution throughout pipe lines, public tanks, and tank trucks.
- Source: IBGE, PNAD - National Survey by Household Sample - 1990-2008. The percentages refer to the total sample of households and not the total population.
- Information provided by the sanitary industry that operates in urban sectors to the Supervision of Sanitation Service with respect to the percentage of residential buildings served by drinking water system.
- Data refer to beginning of 2010.
- Includes leakages.
- Sum of quantities of water distributed by water supply industry establishments by categories of customers: Social customer group, Non-commercial customer group (i.e. household, government institution, and embassies), Commercial and industry customer group, and Special customer group.
- Data include supply by water supply industry (ISIC 36) and self supply, and refer to water abstracted from all sources + reused water + desalinated water.
- Public water supply includes self-supply and other supply.
- Data refer to volume of charged water.
- The figures given here are only pertaining to the water supplied by Male' Water and Sewage Co.Pvt.Ltd.
- Roughly one-third of households on Majuro and 32% on Ebeye are connected to the retriculated water supply system.
- Supply: abstracted volumes of water granted in concessions.
- Public water supply includes self-supply.
- Refers to proportion of population with access to improved water source (MDG indicator), which includes households not connected to ISIC 36 but abstract from wells at home.
- The information corresponds to the province of Lima and the Constitutional province of Callao.
- Prior to the 2004 survey, the water supply connection rate refers to Société Nationale d'Exploitation et de Distribution des Eaux (SONEDE) connections only. As from 2004, the rate refers to both SONEDE and rural engineering connections.
- Data refer to water supply by public (government) supply only.
- The data for freshwater delivered by water supply industry are provided by the public institution only (public network), and are related to the government (public sector only) and where the majority is urban. It does not include private or cooperative networks. The percentage only applies to the population connected to water supply industry from the public sector only.
Definitions & Technical notes:
Water supply industry: It corresponds to ISIC division 36 (the International Standard Industrial Classification of All Economic Activities, ISIC Rev. 4) The water collection treatment and supply industry includes water collection, treatment and distribution activities for domestic and industrial needs. This includes abstraction of water for distribution from various sources (mainly surface water and groundwater), natural water (CPC 1800) treatment for distribution and the actual distribution of natural water (CPC 1800) by pipes, channels and others means. The operation of irrigation canals is also included; however the provision of irrigation services through sprinklers, and similar agricultural support services, is not included.
For OECD/Eurostat countries, data provided for the first and third variables refer to "use of water from public water supply" and "population connected to public water supply". Public Water Supply is water supplied by economic units engaged in collection, purification and distribution of water (including desalting of sea water to produce water as the principal product of interest, and excluding system operation for agricultural purposes and treatment of wastewater solely in order to prevent pollution). It corresponds partly to division 36 (ISIC Rev. 4/NACE Rev. 2) independently of the sector involved. It excludes system operation for agriculture irrigation which are not individual irrigation systems, e.g. irrigation canals. Deliveries of water from one public supply undertaking to another are excluded.
Net freshwater supplied by water supply industry refers to gross freshwater delivered by public water supply industry minus freshwater losses during transport.
Net freshwater supplied by water supply industry per capita is calculated by dividing the net freshwater supplied by water supply industry by the total population of the country.
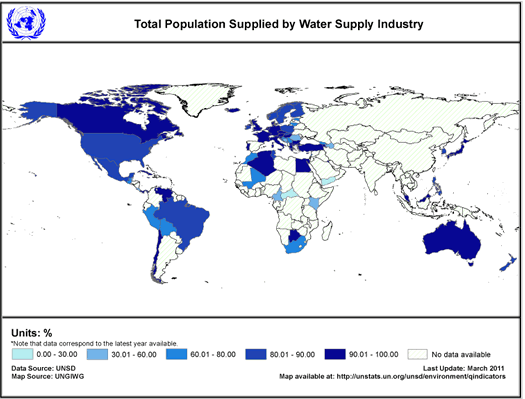
Total population supplied by water supply industry is the percentage of the resident population connected to the water supply.
Net freshwater supplied by water supply industry per capita connected is calculated by dividing the net freshwater supplied by water supply industry by the number of people connected to the water supply industry.
Data Quality:
Data on net freshwater supplied by water supply industry is usually collected from municipalities. Data on total population supplied by water supply industry can be obtained through municipalities or through household surveys. Household surveys usually give more accurate results, since they do not rely on sometimes incomplete information about or held by municipalities.
Data on amounts of water supplied can significantly vary between countries depending on the extent to which water supply industry delivers water to industries, businesses, agriculture and power station in addition to households. Care must be taken when comparing data between countries.
|