ENVIRONMENTAL INDICATORS


Marine and Coastal Areas

 
last update: September 2010


Marine Protected Areas


Proportion
1990

Proportion
2000

Proportion
2009

Marine
Protected Area
2009
%
%
%
km2
Afghanistan1
0.0
0.0
0.0
0
Albania
0.1
0.9
1.5
93
Algeria
0.2
0.2
0.3
92
American Samoa
2.1
2.1
2.1
203
Andorra1
0.0
0.0
0.0
0
Angola
0.1
0.1
0.1
24
Anguilla
0.0
7.0
7.0
59
Antigua and Barbuda
0.5
0.5
0.7
68
Argentina
0.8
1.1
1.1
1 573
Armenia1
0.0
0.0
0.0
0
Aruba
0.0
0.0
0.0
0
Australia
10.9
12.6
28.3
264 359
Austria1
0.0
0.0
0.0
0
Azerbaijan2
0.0
0.0
0.0
0
Bahamas
0.2
0.2
0.4
1 150
Bahrain
0.0
0.0
0.6
30
Bangladesh
0.4
0.5
0.8
324
Barbados
0.1
0.1
0.1
2
Belarus1
0.0
0.0
0.0
0
Belgium
0.0
0.0
0.0
0
Belize
0.3
11.4
11.9
2 227
Benin
0.0
0.0
0.0
0
Bermuda
4.8
5.0
5.0
148
Bhutan1
0.0
0.0
0.0
0
Bolivia1
0.0
0.0
0.0
0
Bosnia and Herzegovina
0.7
0.7
0.7
0
Botswana1
0.0
0.0
0.0
0
Brazil
11.4
17.5
20.1
51 015
British Virgin Islands
1.8
1.9
1.9
30
Brunei Darussalam
0.1
0.1
0.1
4
Bulgaria
0.1
0.4
3.0
197
Burkina Faso1
0.0
0.0
0.0
0
Burundi1
0.0
0.0
0.0
0
Cambodia
0.0
0.9
0.9
141
Cameroon
0.4
0.4
0.4
33
Canada
0.8
1.2
1.2
33 160
Cape Verde
0.0
0.0
0.0
0
Cayman Islands
1.1
1.1
1.2
89
Central African Republic1
0.0
0.0
0.0
0
Chad1
0.0
0.0
0.0
0
Chile
3.4
3.5
3.7
9 594
China
0.4
1.2
1.4
4 828
China, Hong Kong SAR
0.0
0.0
0.0
0
Colombia
3.7
3.7
5.9
4 448
Comoros
0.0
0.0
3.2
404
Congo
0.0
2.1
2.1
1 090
Cook Islands
0.0
0.0
0.0
13
Costa Rica
12.1
12.3
12.3
3 810
Cote d'Ivoire
0.1
0.1
0.1
8
Croatia
1.2
1.2
1.2
389
Cuba
1.3
1.3
2.7
3 359
Cyprus
0.3
0.6
0.6
76
Czech Republic1
0.0
0.0
0.0
0
Dem. Rep. of the Congo
3.7
4.3
4.3
31
Denmark
3.7
3.8
3.8
1 566
Djibouti
0.2
0.2
0.2
12
Dominica
0.1
0.1
0.1
5
Dominican Republic
30.4
30.4
30.4
4 337
Ecuador
0.1
13.0
13.0
139 557
Egypt
4.4
6.0
9.3
5 626
El Salvador
3.2
3.2
3.2
204
Equatorial Guinea
0.0
2.6
2.6
313
Eritrea
0.0
0.0
0.0
0
Estonia
26.1
26.1
26.1
6 435
Ethiopia1
0.0
0.0
0.0
0
Falkland Islands (Malvinas)
0.0
0.0
0.0
0
Fiji
0.1
0.1
0.1
117
Finland
3.5
3.9
5.0
2 560
France
1.1
2.3
3.4
2 453
French Guiana
0.1
5.8
5.8
521
French Polynesia
0.0
0.1
0.1
148
Gabon
0.2
0.5
7.1
1 440
Gambia
0.1
0.1
0.1
2
Georgia
0.2
0.4
0.4
28
Germany
35.7
36.3
36.3
8 451
Ghana
0.0
0.0
0.0
2
Gibraltar
0.0
0.0
0.0
0
Greece
0.6
2.4
2.5
2 833
Greenland
36.2
36.5
36.5
99 737
Grenada
0.0
0.0
0.0
1
Guadeloupe
0.7
1.2
1.2
143
Guam
0.6
0.8
0.8
35
Guatemala
0.3
0.3
12.5
906
Guinea
0.0
0.0
0.0
0
Guinea-Bissau
2.7
45.8
45.8
8 971
Guyana
0.0
0.0
0.0
0
Haiti
0.0
0.0
0.0
0
Honduras
0.0
0.7
1.9
772
Hungary1
0.0
0.0
0.0
0
Iceland
0.1
0.1
0.1
102
India
1.5
1.7
1.7
3 299
Indonesia
0.5
1.0
1.9
64 325
Iran (Islamic Republic of)
1.3
1.3
1.9
1 513
Iraq
0.0
0.0
0.0
0
Ireland
0.1
0.1
0.1
55
Israel
1.0
1.0
1.0
38
Italy
0.5
1.8
16.7
25 932
Jamaica
0.2
4.2
4.2
1 670
Japan
2.0
5.0
5.6
21 535
Jordan
0.0
20.8
20.8
20
Kazakhstan2
0.0
0.0
0.0
0
Kenya
5.1
10.4
10.4
1 383
Kiribati
0.3
0.8
20.2
15 618
Korea, Dem. People's Rep.
0.1
0.1
0.1
59
Korea, Republic of
5.0
5.1
5.3
4 197
Kuwait
0.0
0.0
0.0
1
Kyrgyzstan1
0.0
0.0
0.0
0
Lao People's Dem. Rep.1
0.0
0.0
0.0
0
Latvia
4.6
6.6
6.6
696
Lebanon
0.0
0.1
0.1
5
Lesotho1
0.0
0.0
0.0
0
Liberia
0.0
0.0
0.0
12
Libyan Arab Jamahiriya
0.0
0.0
0.0
20
Liechtenstein1
0.0
0.0
0.0
0
Lithuania
0.8
2.7
2.7
60
Luxembourg1
0.0
0.0
0.0
0
Madagascar
0.0
0.1
0.1
143
Malawi1
0.0
0.0
0.0
0
Malaysia
1.1
1.6
1.6
1 436
Mali1
0.0
0.0
0.0
0
Malta
0.3
0.4
0.4
16
Marshall Islands
0.0
0.6
0.6
692
Martinique
0.5
0.5
0.5
28
Mauritania
32.1
32.1
32.1
6 461
Mauritius
0.3
0.3
0.3
49
Mayotte
0.0
0.2
0.2
38
Mexico
1.9
13.0
16.7
49 123
Micronesia, Federated States of
0.0
0.1
0.1
56
Monaco
0.1
0.1
0.1
0
Mongolia1
0.0
0.0
0.0
0
Montenegro
0.8
0.8
0.8
20
Montserrat
0.0
0.0
0.0
0
Morocco
0.7
1.2
1.2
448
Mozambique
1.8
1.8
3.3
2 274
Myanmar
0.3
0.3
0.3
477
Namibia
0.5
0.5
0.5
168
Nepal1
0.0
0.0
0.0
0
Netherlands
13.5
20.4
21.2
2 935
Netherlands Antilles
0.4
0.5
0.5
57
New Caledonia
0.3
0.3
0.3
380
New Zealand
0.4
0.4
7.1
12 802
Nicaragua
0.7
20.1
20.1
6 289
Niger1
0.0
0.0
0.0
0
Nigeria
0.2
0.2
0.2
30
Niue
0.0
0.0
0.0
1
Northern Mariana Islands
0.0
0.0
0.1
16
Norway
1.0
1.2
2.3
3 353
Oman
0.0
1.3
1.3
685
Pakistan
1.8
1.8
1.8
578
Palau
0.5
2.1
5.3
156
Panama
3.1
4.0
4.0
2 928
Papua New Guinea
0.3
0.3
0.3
2 391
Paraguay1
0.0
0.0
0.0
0
Peru
2.8
2.8
2.8
1 951
Philippines
0.2
1.5
1.5
18 922
Poland
3.8
4.5
4.5
476
Portugal
1.8
1.8
1.8
1 170
Puerto Rico
1.5
1.5
1.6
277
Qatar
0.0
0.3
0.3
29
Republic of Moldova1
0.0
0.0
0.0
0
Reunion
0.0
0.0
0.0
1
Romania
1.5
33.2
33.2
1 944
Russian Federation
3.1
9.1
9.1
119 742
Rwanda1
0.0
0.0
0.0
0
Saint Helena
0.2
0.2
0.2
30
Saint Kitts and Nevis
0.5
0.5
0.5
17
Saint Lucia
0.1
0.1
0.1
2
Saint Pierre and Miquelon
0.0
2.1
2.1
71
Samoa
0.5
0.5
0.5
55
Saudi Arabia
0.6
3.4
3.4
3 291
Senegal
5.8
5.8
12.4
1 392
Serbia1
0.0
0.0
0.0
0
Seychelles
0.5
0.5
0.5
248
Sierra Leone
0.0
0.0
0.0
0
Singapore
0.0
1.6
1.6
9
Slovakia1
0.0
0.0
0.0
0
Slovenia
0.0
0.3
0.6
1
Solomon Islands
0.0
0.1
0.1
264
Somalia
0.0
0.0
0.0
0
South Africa
0.7
3.3
6.5
4 684
Spain
0.6
3.2
3.4
3 967
Sri Lanka
0.1
1.1
1.1
332
St. Vincent and the Grenadines
0.6
0.6
0.6
38
Sudan
0.0
0.0
0.0
12
Suriname
22.9
22.9
22.9
1 982
Swaziland1
0.0
0.0
0.0
0
Sweden
3.7
5.0
5.3
4 306
Switzerland1
0.0
0.0
0.0
0
Syrian Arab Republic
0.0
0.6
0.6
24
Tajikistan1
0.0
0.0
0.0
0
Thailand
4.0
4.3
4.3
4 769
The Former Yugoslav Rep. of Macedonia1
0.0
0.0
0.0
0
Timor-Leste
0.0
1.1
6.7
1 007
Togo
0.0
0.0
0.0
0
Tokelau
0.0
0.1
0.1
9
Tonga
0.0
2.5
2.5
9 984
Trinidad and Tobago
0.2
2.8
2.8
466
Tunisia
1.1
1.2
1.2
433
Turkey
2.4
2.4
2.4
1 935
Turkmenistan2
0.0
0.0
0.0
0
Turks and Caicos Islands
0.3
1.0
1.0
150
Tuvalu
0.0
0.2
0.2
36
Uganda1
0.0
0.0
0.0
0
Ukraine
4.1
4.9
4.9
2 087
United Arab Emirates
0.3
0.3
2.6
775
United Kingdom
4.7
5.2
5.2
8 675
United Rep. of Tanzania
3.7
10.0
10.0
3 688
United States
18.3
24.1
24.7
227 839
United States Virgin Islands
0.4
0.6
0.6
37
Uruguay
0.2
0.2
0.2
35
Uzbekistan1
0.0
0.0
0.0
0
Vanuatu
0.0
0.0
0.1
58
Venezuela (Bolivarian Republic of)
7.0
15.3
15.3
14 399
Viet Nam
0.3
0.5
2.1
3 207
Wallis and Futuna Islands
0.0
0.0
0.0
0
Western Sahara
8.1
8.4
8.4
0
Yemen
0.0
1.9
1.9
1 251
Zambia1
0.0
0.0
0.0
0
Zimbabwe1
0.0
0.0
0.0
0


Sources:

UNSD Millennium Development Goals Database (see http://mdgs.un.org/unsd/mdg/Data.aspx).

Footnotes:

  1. Landlocked country.
  2. Landlocked country with territorial water claims within the Caspian Sea (inland sea).


Definitions & Technical notes:

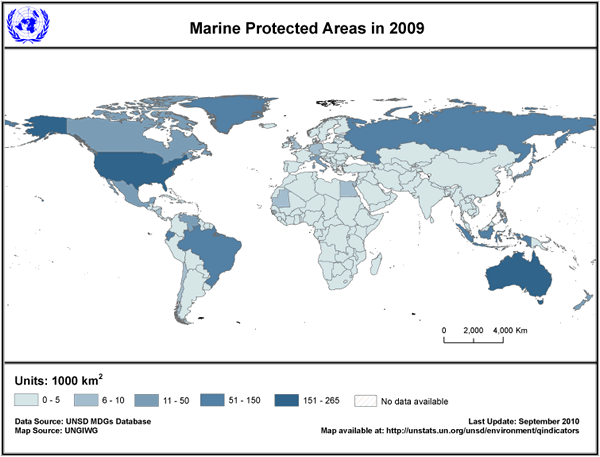
The definition of a “marine protected area (MPA)”, as adopted by the World Conservation Union (IUCN), is “any area of intertidal or sub tidal terrain, together with its overlying water and associated flora, fauna, historical and cultural features, which has been reserved by law or other effective means to protect part or all of the enclosed environment”. (IUCN 1988. Resolution 17.38 of the 17th General Assembly of the IUCN. IUCN; Gland; Switzerland and Cambridge; UK)

Proportions are calculated as the total marine protected area extent divided by the area of territorial waters (up to 12 nautical miles).

Protected areas increase with time and are not deleted from subsequent years. Only protected areas that are “nationally designated” are included in this indicator. The status "designated" is attributed to a protected area when the authority that corresponds, according to national legislation or common practice (e.g. by means of an executive decree), officially endorses a document of designation. The designation must be for conservation of biodiversity, not single species and not fortuitous de facto protection arising because of some other activity (e.g. military). Hence, a number of United States Marine Managed Areas as well as permanent fisheries closures are excluded.

Data are adjusted to account for transboundary protected areas (protected areas that transcend international boundaries) to ensure that the appropriate area/extent from the total area for that site is attributed to the country in which it is contained. Similar adjustments have been made where a protected area transcends both marine and terrestrial environments.

The size of the protected area (its “extent”) is the officially documented total area provided by the national authority or as listed by the World Database on Protected Areas and may be generated from spatial (GIS) boundary data (see source for details). Many protected areas can contain proportions of both the marine and terrestrial environment, and the size of the protected area extent that falls into each environment is not always available. The table also includes some protected areas for which the year (date of establishment/designation) is unavailable.

Where the documented total area is unavailable the following rules have been applied:
1. Where the documented total area of the site is unavailable but the spatial (GIS) boundary is present in the WDPA, the total area calculated from the GIS will be used; and
2. Where spatial (GIS) boundaries and the documented area from national sources are unavailable, UNEP-WCMC works with the collaborating NGOs to help source this information. Where no additional information, either from national sources or NGOs, can be found then the site is excluded from the statistics.

If no update is received for a given year, the total number and size of the protected area is assumed to be equal to the previous year’s values.


Data Quality:

The World Database on Protected Areas (WDPA) is compiled from multiple sources and is the most comprehensive global dataset on marine and terrestrial protected areas available. It is a joint project of UNEP-WCMC and the IUCN World Commission on Protected Areas working with governments and collaborating non-governmental organizations (NGOs).

A major source of information is through the UN List process, which takes place every 4-5 years. As part of this process, key stakeholders review and provide information to assist in the compilation of the UN List of Protected areas. In the intervening period between UN Lists, UNEP-WCMC works closely with national authorities and NGOs to continually update the WDPA, as new information becomes available.

There are known data and knowledge gaps that exist in some countries/regions due to difficulties in: reporting capacities; measuring the proportion of a protected area within the terrestrial and/or marine environment; and determining whether a site conforms to the IUCN definition of a protected area/MPA.

The list of protected areas does not provide information on non-designated protected areas that may also be important for conserving biodiversity. Further, the spatial extent of nationally designated protected areas does not indicate how well managed the area is in practice, nor does it confirm that protection measures are actually enforced for the entire extent. However, UNEP-WCMC and IUCN have defined and monitor categorizes of nationally designated protected areas in order to improve data quality

For more information visit the World Database on Protected Areas (WDPA) website at: www.wdpa.org/.


<div align="center">United Nations Statistics Division - Environment Statistics</div>