Webinars

Keynote speakers
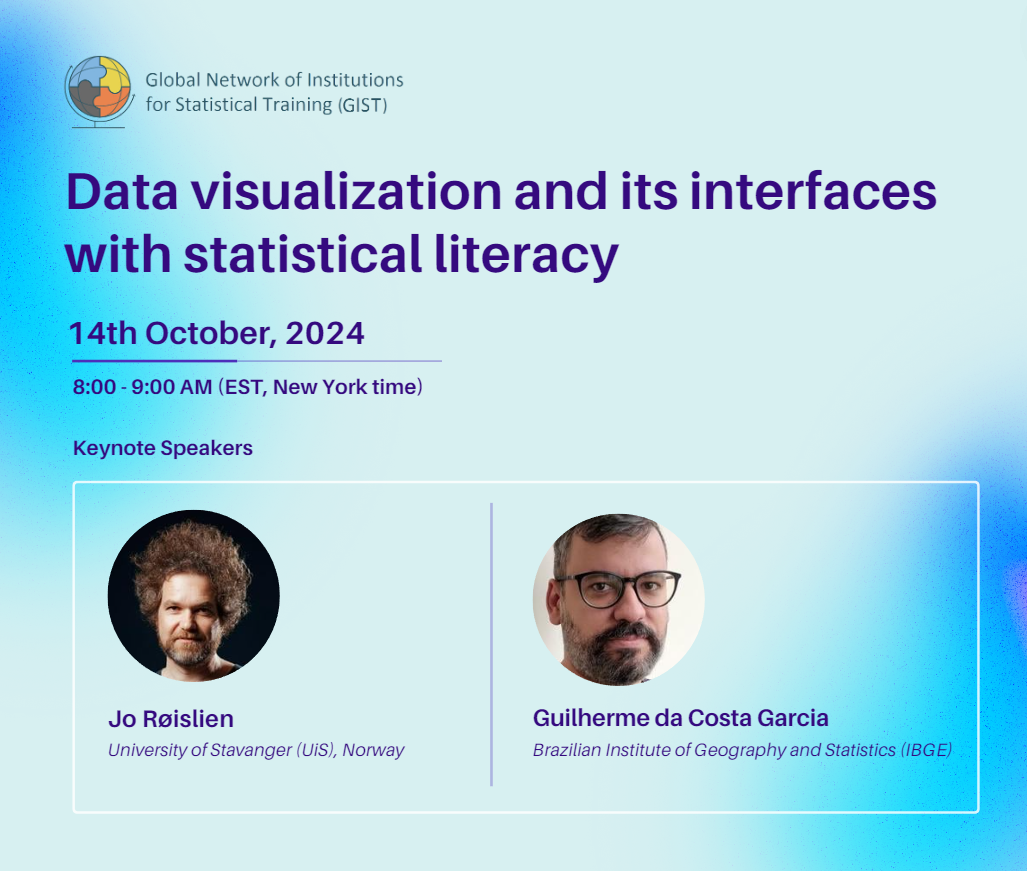
- Jo Røislien, University of Stavanger, Norway
- Guilherme da Cost Garcia, Brazilian Institute of Geography and Statistics (IBGE)
GROW Webinar: Data visualization and its interfaces with statistical literacy
Seeing is believing: Visualizing statistics using video
By Jo Røislien, University of Stavanger, Norway
Video makes up 80% of internet traffic, and knowing how to utilize this medium properly is thus essential to reach a large audience. Statistics are no exception. In addition to being a professor of statistics, Jo Røislien has more than ten years of practical mass media experience, creating science-based based TV-series, web series, and ads. Through concrete examples, Røislien will show how video can be used creatively to explain statistical concepts, increase statistical literacy – and create a more positive view of statistics.
Elements of data engagement: Facilitating understanding for young readers
By Guilherme da Cost Garcia, Brazilian Institute of Geography and Statistics (IBGE)
Statistics are abstractions of reality, representing it through data. To truly grasp the meaning of this data, one must understand how it impacts the individual context. Given a heterogeneous population with varying levels of data literacy, how can we translate these abstractions into personal relevance? In this presentation, Guilherme da Cost Garcia outlines methods and heuristics to facilitate this engagement, recently applied in a project to translate IBGE census information for Brazilian school students.
GROW Webinar: Data visualization and its interfaces with statistical literacy
14 October 2024 8:00 ‐ 9:00 am (EST)Webinar language: English