| |
|
|
|
|
|
|
|
|
|
| |
latest
year available |
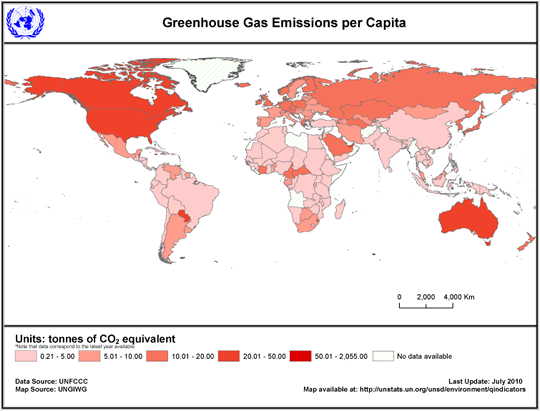
Total GHG
emissions |
|
% change since
1990 |
|
GHG emissions
per capita |
|
Total GHG
emissions
including
LULUCF/LUCF |
|
|
|
|
|
|
|
|
|
|
|
| |
|
mio. tonnes of CO2 equivalent |
|
% |
|
tonnes of CO2 equivalent |
|
mio. tonnes of CO2 equivalent |
|
| Albania |
1994 |
5.53 |
|
-22.4 |
|
1.74 |
|
7.06 |
|
| Algeria |
1994 |
91.76 |
|
... |
|
3.31 |
|
100.34 |
|
| Antigua and Barbuda |
1990 |
0.39 |
|
|
|
6.28 |
|
0.29 |
|
| Argentina |
2000 |
282.00 |
|
22.0 |
|
7.63 |
|
238.70 |
|
| Armenia |
1990 |
25.31 |
|
|
|
7.14 |
|
24.70 |
|
| Australia |
2008 |
549.54 |
|
31.4 |
|
26.08 |
|
618.06 |
|
| Austria |
2008 |
86.64 |
|
10.8 |
|
10.39 |
|
69.30 |
|
| Azerbaijan |
1994 |
43.17 |
|
-29.0 |
|
5.62 |
|
42.09 |
| Bahamas |
1994 |
2.20 |
|
14.7 |
|
7.96 |
|
2.20 |
| Bahrain |
1994 |
19.60 |
|
... |
|
34.90 |
|
19.60 |
| Bangladesh |
1994 |
45.93 |
|
... |
|
0.37 |
|
53.76 |
| Barbados |
1997 |
4.06 |
|
23.8 |
|
15.89 |
|
4.05 |
| Belarus |
2008 |
91.11 |
|
-35.1 |
|
9.41 |
|
60.08 |
| Belgium |
2008 |
133.25 |
|
-7.1 |
|
12.58 |
|
131.98 |
| Belize |
1994 |
6.34 |
|
... |
|
29.60 |
|
2.31 |
| Benin |
1995 |
39.35 |
|
... |
|
6.87 |
|
-8.18 |
| Bhutan |
1994 |
1.29 |
|
... |
|
2.52 |
|
-2.26 |
| Bolivia |
2004 |
43.67 |
|
185.0 |
|
4.85 |
|
91.71 |
| Botswana |
1994 |
9.29 |
|
... |
|
6.15 |
|
-29.44 |
| Brazil |
1994 |
663.25 |
|
11.2 |
|
4.16 |
|
1 481.33 |
| Bulgaria |
2008 |
73.43 |
|
-37.4 |
|
9.67 |
|
62.40 |
| Burkina Faso |
1994 |
5.97 |
|
... |
|
0.61 |
|
4.58 |
| Burundi |
1998 |
2.00 |
|
... |
|
0.32 |
|
-1.00 |
| Cambodia |
1994 |
12.76 |
|
... |
|
1.15 |
|
-5.15 |
| Cameroon |
1994 |
165.73 |
|
... |
|
12.10 |
|
187.91 |
| Canada |
2008 |
734.42 |
|
24.1 |
|
22.08 |
|
721.59 |
| Cape Verde |
1995 |
0.29 |
|
... |
|
0.74 |
|
0.22 |
| Central African Republic |
1994 |
37.74 |
|
... |
|
11.61 |
|
-101.58 |
| Chad |
1993 |
8.02 |
|
... |
|
1.20 |
|
-38.18 |
| Chile |
1994 |
54.89 |
|
... |
|
3.87 |
|
45.69 |
| China |
1994 |
4 057.62 |
|
... |
|
3.39 |
|
3 650.14 |
| Colombia |
1994 |
137.48 |
|
22.9 |
|
3.84 |
|
152.08 |
| Comoros |
1994 |
0.51 |
|
... |
|
1.06 |
|
-0.38 |
| Congo |
2000 |
2.07 |
|
... |
|
0.68 |
|
-80.00 |
| Cook Islands |
1994 |
0.08 |
|
... |
|
4.34 |
|
-0.07 |
| Costa Rica |
2005 |
12.11 |
|
98.9 |
|
2.80 |
|
8.61 |
| Cote d'Ivoire |
2000 |
271.20 |
|
... |
|
15.69 |
|
252.82 |
| Croatia |
2008 |
31.13 |
|
-0.9 |
|
7.04 |
|
24.65 |
| Cuba |
1996 |
40.19 |
|
-36.8 |
|
3.67 |
|
18.54 |
| Czech Republic |
2008 |
141.41 |
|
-27.5 |
|
13.70 |
|
136.63 |
| Dem. Rep. of the Congo |
2003 |
46.00 |
|
... |
|
0.83 |
|
-132.78 |
| Denmark |
2008 |
65.13 |
|
-7.3 |
|
11.93 |
|
66.60 |
| Djibouti |
1994 |
0.51 |
|
... |
|
0.84 |
|
-0.09 |
| Dominica |
1994 |
0.15 |
|
... |
|
2.22 |
|
-0.22 |
| Dominican Republic |
2000 |
26.43 |
|
109.1 |
|
2.99 |
|
7.64 |
| Ecuador |
1990 |
30.77 |
|
|
|
2.99 |
|
77.72 |
| Egypt |
1990 |
116.74 |
|
|
|
2.02 |
|
106.84 |
| El Salvador |
1994 |
11.72 |
|
... |
|
2.07 |
|
15.66 |
| Eritrea |
2000 |
0.76 |
|
... |
|
0.21 |
|
0.76 |
| Estonia |
2008 |
20.25 |
|
-50.4 |
|
15.10 |
|
10.52 |
| Ethiopia |
1995 |
47.75 |
|
11.0 |
|
0.84 |
|
37.87 |
| Fiji |
1994 |
1.39 |
|
... |
|
1.83 |
|
-6.31 |
| Finland |
2008 |
70.13 |
|
-0.3 |
|
13.22 |
|
34.73 |
| France |
2008 |
531.80 |
|
-6.1 |
|
8.57 |
|
464.44 |
| Gabon |
1994 |
6.52 |
|
... |
|
6.20 |
|
-494.35 |
| Gambia |
1993 |
4.26 |
|
... |
|
4.23 |
|
-45.73 |
|
| Georgia |
2006 |
12.22 |
|
-73.1 |
|
2.77 |
|
12.22 |
|
| Germany |
2008 |
958.06 |
|
-22.2 |
|
11.65 |
|
988.25 |
|
| Ghana |
1996 |
13.14 |
|
17.8 |
|
0.74 |
|
-5.88 |
|
| Greece |
2008 |
126.89 |
|
22.8 |
|
11.39 |
|
123.71 |
|
| Grenada |
1994 |
1.61 |
|
... |
|
16.17 |
|
1.51 |
|
| Guatemala |
1990 |
14.74 |
|
|
|
1.65 |
|
-24.80 |
|
| Guinea |
1994 |
5.06 |
|
... |
|
0.70 |
|
-12.54 |
|
| Guinea-Bissau |
1994 |
1.69 |
|
... |
|
1.49 |
|
- 11 286.71 |
|
| Guyana |
1998 |
3.07 |
|
40.7 |
|
4.05 |
|
- 27.80 |
|
| Haiti |
1994 |
5.10 |
|
... |
|
0.66 |
|
6.06 |
|
| Honduras |
1995 |
10.83 |
|
... |
|
1.94 |
|
15.46 |
|
| Hungary |
2008 |
73.14 |
|
-24.9 |
|
7.30 |
|
68.62 |
|
| Iceland |
2008 |
4.88 |
|
42.9 |
|
15.47 |
|
6.88 |
|
| India |
1994 |
1 214.25 |
|
... |
|
1.30 |
|
1 228.54 |
|
| Indonesia |
1994 |
334.19 |
|
25.3 |
|
1.77 |
|
498.31 |
|
| Iran (Islamic Republic of) |
1994 |
385.43 |
|
... |
|
6.30 |
|
417.01 |
|
| Ireland |
2008 |
67.44 |
|
23.0 |
|
15.20 |
|
65.97 |
|
| Israel |
2005 |
73.41 |
|
... |
|
10.97 |
|
73.02 |
|
| Italy |
2008 |
541.49 |
|
4.7 |
|
9.08 |
|
454.19 |
|
| Jamaica |
1994 |
116.31 |
|
... |
|
47.58 |
|
116.15 |
|
| Japan |
2008 |
1 281.82 |
|
1.0 |
|
10.07 |
|
1 203.01 |
|
| Jordan |
2000 |
19.40 |
|
... |
|
4.00 |
|
20.14 |
|
| Kazakhstan |
2008 |
245.86 |
|
-27.3 |
|
15.84 |
|
245.22 |
|
| Kenya |
1994 |
21.47 |
|
... |
|
0.80 |
|
-6.53 |
|
| Kiribati |
1994 |
0.03 |
|
... |
|
0.37 |
|
0.03 |
|
| Korea, Dem. People's Rep. |
1990 |
201.92 |
|
|
|
10.02 |
|
187.30 |
|
| Korea, Republic of |
2001 |
542.89 |
|
87.6 |
|
11.62 |
|
508.25 |
|
| Kyrgyzstan |
2005 |
12.02 |
|
-60.3 |
|
2.30 |
|
11.33 |
|
| Lao People's Dem. Rep. |
1990 |
6.87 |
|
|
|
1.63 |
|
-97.44 |
|
| Latvia |
2008 |
11.90 |
|
-55.6 |
|
5.27 |
|
-16.97 |
|
| Lebanon |
1994 |
15.70 |
|
... |
|
4.63 |
|
15.91 |
|
| Lesotho |
1994 |
1.82 |
|
... |
|
1.07 |
|
3.08 |
|
| Liechtenstein |
2008 |
0.26 |
|
14.7 |
|
7.39 |
|
0.26 |
|
| Lithuania |
2008 |
24.33 |
|
-51.1 |
|
7.33 |
|
10.64 |
|
| Luxembourg |
2008 |
12.49 |
|
-4.8 |
|
26.00 |
|
12.22 |
|
| Madagascar |
1994 |
21.93 |
|
... |
|
1.72 |
|
-217.04 |
|
| Malawi |
1994 |
7.07 |
|
-12.1 |
|
0.71 |
|
24.59 |
|
| Malaysia |
1994 |
136.68 |
|
... |
|
6.81 |
|
75.60 |
|
| Maldives |
1994 |
0.15 |
|
... |
|
0.63 |
|
0.15 |
|
| Mali |
1995 |
8.67 |
|
... |
|
0.91 |
|
-1.08 |
|
| Malta |
2008 |
2.95 |
|
44.2 |
|
7.25 |
|
2.89 |
|
| Mauritania |
2000 |
6.94 |
|
... |
|
2.67 |
|
5.62 |
|
| Mauritius |
1995 |
2.06 |
|
... |
|
1.82 |
|
1.84 |
|
| Mexico |
2002 |
553.33 |
|
30.1 |
|
5.42 |
|
643.18 |
|
| Micronesia, Federated States of |
1994 |
0.25 |
|
... |
|
2.32 |
|
0.25 |
|
| Monaco |
2008 |
0.10 |
|
-11.4 |
|
2.92 |
|
0.10 |
|
| Mongolia |
1998 |
15.93 |
|
-17.5 |
|
6.83 |
|
15.60 |
|
| Morocco |
1994 |
44.39 |
|
... |
|
1.67 |
|
39.88 |
|
| Mozambique |
1994 |
8.22 |
|
21.2 |
|
0.53 |
|
15.97 |
|
| Namibia |
1994 |
5.60 |
|
... |
|
3.54 |
|
-0.11 |
|
| Nauru |
1994 |
0.04 |
|
... |
|
3.64 |
|
0.03 |
|
| Nepal |
1994 |
31.19 |
|
... |
|
1.48 |
|
39.31 |
|
| Netherlands |
2008 |
206.91 |
|
-2.4 |
|
12.52 |
|
209.36 |
|
| New Zealand |
2008 |
74.66 |
|
22.8 |
|
17.65 |
|
48.48 |
|
| Nicaragua |
1994 |
7.65 |
|
... |
|
1.68 |
|
-5.40 |
|
| Niger |
2000 |
13.63 |
|
180.8 |
|
1.24 |
|
-3.16 |
|
| Nigeria |
1994 |
242.63 |
|
... |
|
2.25 |
|
347.64 |
|
| Niue |
1994 |
4.42 |
|
... |
|
2 053.95 |
1 |
4.51 |
|
| Norway |
2008 |
53.71 |
|
8.0 |
|
11.27 |
|
25.15 |
|
| Pakistan |
1994 |
160.59 |
|
... |
|
1.26 |
|
167.12 |
|
| Palau |
2000 |
0.09 |
|
... |
|
4.80 |
|
0.09 |
|
| Panama |
1994 |
10.69 |
|
... |
|
4.08 |
|
34.40 |
|
| Papua New Guinea |
1994 |
5.01 |
|
... |
|
1.09 |
|
4.60 |
|
| Paraguay |
1994 |
140.46 |
|
149.9 |
|
29.94 |
|
159.96 |
|
| Peru |
1994 |
57.58 |
|
... |
|
2.45 |
|
98.80 |
|
| Philippines |
1994 |
100.87 |
|
... |
|
1.47 |
|
100.74 |
|
| Poland |
2008 |
395.56 |
|
-12.7 |
|
10.38 |
|
356.38 |
|
| Portugal |
2008 |
78.38 |
|
32.2 |
|
7.34 |
|
75.42 |
|
| Republic of Moldova |
2005 |
11.88 |
|
-72.3 |
|
3.16 |
|
10.50 |
|
| Romania |
2008 |
145.92 |
|
-39.7 |
|
6.83 |
|
109.50 |
|
| Russian Federation |
2008 |
2 229.57 |
|
-32.9 |
|
15.77 |
|
1 690.97 |
|
| Rwanda |
2002 |
2.38 |
|
... |
|
0.28 |
|
-4.63 |
|
| Saint Kitts and Nevis |
1994 |
0.16 |
|
... |
|
3.87 |
|
0.07 |
|
| Saint Lucia |
1994 |
0.89 |
|
... |
|
6.09 |
|
0.54 |
|
| Samoa |
1994 |
0.56 |
|
... |
|
3.36 |
|
0.48 |
|
| San Marino |
2007 |
0.24 |
|
... |
|
7.67 |
|
0.23 |
|
| Sao Tome and Principe |
1998 |
0.12 |
|
... |
|
0.90 |
|
-1.42 |
|
| Saudi Arabia |
1990 |
165.27 |
|
|
|
10.16 |
|
150.03 |
|
| Senegal |
1995 |
9.57 |
|
... |
|
1.11 |
|
3.57 |
|
| Seychelles |
1995 |
0.26 |
|
... |
|
3.39 |
|
-0.58 |
|
| Singapore |
1994 |
26.86 |
|
... |
|
7.96 |
|
26.86 |
|
| Slovakia |
2008 |
48.83 |
|
-33.9 |
|
9.04 |
|
46.75 |
|
| Slovenia |
2008 |
21.28 |
|
15.2 |
|
10.56 |
|
12.75 |
|
| Solomon Islands |
1994 |
0.29 |
|
... |
|
0.84 |
|
0.29 |
|
| South Africa |
1994 |
379.84 |
|
9.4 |
|
9.38 |
|
361.22 |
|
| Spain |
2008 |
405.74 |
|
42.3 |
|
9.12 |
|
353.97 |
|
| Sri Lanka |
1995 |
29.13 |
|
... |
|
1.60 |
|
408.21 |
|
| St. Vincent and the Grenadines |
1997 |
0.41 |
|
4.6 |
|
3.80 |
|
0.28 |
|
| Sudan |
1995 |
54.19 |
|
... |
|
1.76 |
|
71.97 |
|
| Suriname |
2003 |
3.33 |
|
... |
|
6.83 |
|
4.87 |
|
| Swaziland |
1994 |
7.54 |
|
... |
|
7.95 |
|
4.29 |
|
| Sweden |
2008 |
63.96 |
|
-11.7 |
|
6.95 |
|
49.29 |
|
| Switzerland |
2008 |
53.22 |
|
0.5 |
|
7.06 |
|
53.44 |
|
| Tajikistan |
2003 |
7.50 |
|
-69.0 |
|
1.18 |
|
5.57 |
|
| Thailand |
1994 |
223.99 |
|
... |
|
3.76 |
|
285.84 |
|
| The Former Yugoslav Rep. of Macedonia |
2002 |
12.23 |
|
-7.7 |
|
6.04 |
|
9.61 |
|
| Togo |
1998 |
6.28 |
|
... |
|
1.28 |
|
34.41 |
|
| Tonga |
1994 |
0.23 |
|
... |
|
2.36 |
|
-0.08 |
|
| Trinidad and Tobago |
1990 |
16.01 |
|
|
|
13.13 |
|
14.51 |
|
| Tunisia |
1994 |
25.14 |
|
... |
|
2.85 |
|
23.37 |
|
| Turkey |
2008 |
366.50 |
|
96.0 |
|
4.96 |
|
285.92 |
|
| Turkmenistan |
1994 |
52.31 |
|
... |
|
12.77 |
|
51.93 |
|
| Tuvalu |
1994 |
0.01 |
|
... |
|
0.61 |
|
0.01 |
|
| Uganda |
1994 |
41.55 |
|
... |
|
2.05 |
|
49.80 |
|
| Ukraine |
2008 |
427.80 |
|
-53.9 |
|
9.30 |
|
411.21 |
|
| United Arab Emirates |
2000 |
129.83 |
|
... |
|
40.10 |
|
120.17 |
|
| United Kingdom |
2008 |
631.73 |
|
-18.5 |
|
10.32 |
|
629.79 |
|
| United Rep. of Tanzania |
1994 |
39.24 |
|
0.6 |
|
1.35 |
|
952.80 |
2 |
| United States |
2008 |
6 924.56 |
|
13.3 |
|
22.22 |
|
6 016.41 |
|
| Uruguay |
2000 |
29.73 |
|
7.5 |
|
8.95 |
|
17.19 |
|
| Uzbekistan |
2005 |
199.84 |
|
9.3 |
|
7.59 |
|
200.25 |
|
| Vanuatu |
1994 |
0.30 |
|
... |
|
1.78 |
|
0.30 |
|
| Venezuela (Bolivarian Republic of) |
1999 |
192.19 |
|
... |
|
8.03 |
|
177.90 |
|
| Viet Nam |
1994 |
84.45 |
|
... |
|
1.18 |
|
103.84 |
|
| Yemen |
1995 |
17.87 |
|
... |
|
1.15 |
|
8.20 |
|
| Zambia |
1994 |
32.77 |
|
... |
|
3.70 |
|
36.23 |
|
| Zimbabwe |
1994 |
27.59 |
|
... |
|
2.40 |
|
-34.65 |
|
| |
|
|
|
|
|
|
|
|
|
| Sources: |
| UN Framework Convention on Climate Change (UNFCCC) Secretariat (see: http://unfccc.int). |
| United Nations, Department of Economic and Social Affairs, Population Division, World Population Prospects: The 2008 Revision, New York, 2009 (advanced Excel tables). |
| Footnotes: |
- 1994 is considered as an uncharacteristically high in terms of GHG emissions. It was mainly influenced by large-scale extension of Niue's international airport runway, and the major construction and sealing of roads (230 km). The high per capita figure is also due to a very small population base.
- There was large increase in emissions due the conversion of the forest and grassland to pastures, cropland, or other managed uses, which can significantly change carbon stored in vegetation and soil.
|
| |
| Definitions & Technical notes: |
| Greenhouse gases (GHG) are those gaseous constituents of the atmosphere, both natural and anthropogenic, that absorb and emit radiation at specific wavelengths within the spectrum of thermal infrared radiation emitted by the Earths surface, the atmosphere itself, and by clouds. This property causes the greenhouse effect. Water vapour (H2O), carbon dioxide (CO2), nitrous oxide (N2O), methane (CH4) and ozone (O3) are the primary greenhouse gases in the Earths atmosphere. Moreover, there are a number of entirely human-made greenhouse gases in the atmosphere, such as the halocarbons and other chlorine- and bromine-containing substances, dealt with under the Montreal Protocol. Beside CO2, N2O and CH4, the Kyoto Protocol deals with the greenhouse gases sulphur hexafluoride (SF6), hydrofluorocarbons (HFCs) and perfluorocarbons (PFCs). |
| Total GHG emissions including LULUCF/LUCF refer to greenhouse gases emissions including emissions/removals from the forestry sector. The definition is different for Annex I and non-Annex I Parties. For Annex I Parties, the sector is called Land Use, Land-use Change and Forestry (LULUCF) whereas for non-Annex I Parties, it is called Land-use Change and Forestry (LUCF). These two definitions are close but not equivalent. Land use, land use change and forest may have an impact on the surface albedo, evapotranspiration, sources and sinks of greenhouse gases, or other properties of the climate system and may thus have a radioactive forcing and/or other impacts on climate, locally or globally. |
| Data on greenhouse gas emissions are usually estimated according to international methodologies on the basis of national statistics on energy, industrial and agricultural production, waste management and land use, etc. |
| The best known and most widely used methodology is the 1996 Guidelines of the Intergovernmental Panel for Climate Change (IPCC) (see http://www.ipcc-nggip.iges.or.jp/public/gl/invs1.htm) which is the basis for reporting to the UNFCCC. The latest revision and update of this guideline is 2006 IPCC Guidelines for National Greenhouse Gas Inventories (see http://www.ipcc-nggip.iges.or.jp/public/2006gl/index.htm). |
| GHG emissions per capita is calculated by UNSD. |
| For some non-Annex I countries, the GHG emissions data may be incomplete because they include only emissions from a few available sources and therefore do not represent the absolute total emissions of the country. For detailed information on emissions data and their completeness, please check the official submissions of GHG emissions/removals data by countries to the Climate Change Convention (http://unfccc.int/ghg_data/ghg_data_unfccc/data_sources/items/3816.php). |
| Data Quality: |
| Countries report their greenhouse gas emissions to UNFCCC according to the IPCC Guidelines. The quality of data is regularly checked through the UNFCCC review process for the Annex I Parties to the Convention that report the data annually. Non-Annex I countries do not report the data annually and their data are not subject to the same review procedures. Data quality depends on the quality of statistics underlying the calculations or estimates and is usually the best for energy related emissions; because of differences in completeness and quality of the estimates, the data should be used with caution when comparing countries. |
| |
|
|
|
|
|
|
|
|
|
|