last update: August 2010

ENVIRONMENTAL INDICATORS

Air pollution:

Consumption of Ozone-Depleting Substances (ODS)


Consumption of CFCs
 
Consumption of all ODS
 
 
Baseline
2008
Reduction
from
baseline
2002
2008
Reduction
from
2002


ODP tonnes
ODP tonnes
%
ODP tonnes
ODP tonnes
%
 
Afghanistan
380.0
40.0
89.5
181.5
1
47.9
 
73.6
1
Albania
40.8
0.0
 
100.0
 
50.5
4.1
 
91.9
 
Algeria
2 119.5
149.6
 
92.9
 
1 966.1
236.9
 
88.0
 
Andorra
67.5
...
2
...
 
...
2
...
2
...
 
Angola
114.8
9.7
 
91.6
 
110.0
20.2
 
81.6
 
Antigua and Barbuda
10.7
0.1
 
99.1
 
4.0
0.3
 
92.5
 
Argentina
4 697.2
50.9
 
98.9
 
2 386.0
654.8
 
72.6
 
Armenia
196.5
13.6
 
93.1
 
174.4
18.4
 
89.4
 
Australia
14 290.4
-42.0
3
100.3
 
389.5
58.5
 
85.0
 
Azerbaijan
480.6
0.0
 
100.0
 
12.1
0.8
 
93.4
 
Bahamas
64.9
0.0
 
100.0
 
58.4
3.9
 
93.3
 
Bahrain
135.4
11.7
 
91.4
 
138.1
50.5
 
63.4
 
Bangladesh
581.6
158.3
 
72.8
 
350.1
223.1
 
36.3
 
Barbados
21.5
1.1
 
94.9
 
12.1
3.2
 
73.6
 
Belarus
2 510.9
0.0
 
100.0
 
2.7
1.0
 
63.0
 
Belize
24.4
0.0
 
100.0
 
21.7
1.8
 
91.7
 
Benin
59.9
5.2
 
91.3
 
36.0
6.0
 
83.3
 
Bhutan
0.2
0.0
 
100.0
 
0.1
1
0.1
 
0.0
1
Bolivia
75.7
2.6
 
96.6
 
67.4
8.6
 
87.2
 
Bosnia and Herzegovina
24.2
8.8
 
63.6
 
259.2
16.4
 
93.7
 
Botswana
6.9
0.3
 
95.7
 
10.2
13.6
 
-33.3
 
Brazil
10 525.8
290.4
 
97.2
 
3 589.4
2 089.8
 
41.8
 
Brunei Darussalam
78.2
2.4
 
96.9
 
46.3
7.6
 
83.6
 
Burkina Faso
36.3
0.0
 
100.0
 
16.3
27.2
 
- 66.9
 
Burundi
59.0
1.0
 
98.3
 
19.2
1.0
 
94.8
 
Cambodia
94.2
1.4
 
98.5
 
97.0
9.3
 
90.4
 
Cameroon
256.9
17.0
 
93.4
 
261.7
36.1
 
86.2
 
Canada
19 958.2
0.0
 
100.0
 
923.1
509.9
 
44.8
 
Cape Verde
2.3
0.0
 
100.0
 
1.8
0.8
 
55.6
 
Central African Republic
11.2
0.0
 
100.0
 
4.6
6.7
 
- 45.7
 
Chad
34.6
2.2
 
93.6
 
27.3
21.5
 
21.2
 
Chile
828.7
47.9
 
94.2
 
591.9
304.0
 
48.6
 
China
57 818.7
263.0
4
99.5
4
47 804.1
4
17 386.3
4
63.6
4
Colombia
2 208.2
208.0
 
90.6
 
1 002.2
414.8
 
58.6
 
Comoros
2.5
0.0
 
100.0
 
1.9
0.2
 
89.5
 
Congo
11.9
1.4
 
88.2
 
7.0
2.0
 
71.4
 
Cook Islands
1.7
0.0
 
100.0
 
0.0
5
0.0
 
0.0
5
Costa Rica
250.2
13.9
 
94.4
 
425.4
237.0
 
44.3
 
Cote d'Ivoire
294.2
12.0
 
95.9
 
121.2
24.1
 
80.1
 
Croatia
219.3
0.0
 
100.0
 
172.3
7.7
 
95.5
 
Cuba
625.1
74.4
 
88.1
 
518.0
87.7
 
83.1
 
Dem. Rep. of the Congo
665.7
8.6
 
98.7
 
1 081.3
16.6
 
98.5
 
Djibouti
21.0
0.9
 
95.7
 
15.8
1.5
 
90.5
 
Dominica
1.5
0.0
 
100.0
 
3.1
0.0
 
100.0
 
Dominican Republic
539.8
4.5
 
99.2
 
406.9
53.4
 
86.9
 
Ecuador
301.4
8.2
 
97.3
 
273.4
79.8
 
70.8
 
Egypt
1 668.0
187.8
 
88.7
 
1 944.1
726.2
 
62.6
 
El Salvador
306.5
0.0
 
100.0
 
108.1
11.6
 
89.3
 
Equatorial Guinea
31.5
2.3
 
92.7
 
27.9
8.1
 
71.0
 
Eritrea
41.1
2.8
 
93.2
 
32.2
6
3.1
 
90.4
6
Ethiopia
33.8
4.3
 
87.3
 
86.6
4.3
 
95.0
 
European Union (EU)
301 930.2
7
-552.0
3,7
100.2
7
-6 754.6
3,7
-9 805.1
3,7
45.2
7
Fiji
33.4
0.0
 
100.0
 
5.3
4.8
 
9.4
 
Gabon
10.3
0.0
 
100.0
 
6.9
5.2
 
24.6
 
Gambia
23.8
0.4
 
98.3
 
4.9
0.5
 
89.8
 
Georgia
22.5
0.0
 
100.0
 
64.3
5.9
 
90.8
 
Ghana
35.8
0.0
 
100.0
 
24.0
21.6
 
10.0
 
Grenada
6.0
0.0
 
100.0
 
2.3
0.5
 
78.3
 
Guatemala
224.6
1.4
 
99.4
 
952.5
184.3
 
80.7
 
Guinea
42.4
1.6
 
96.2
 
31.4
2.7
 
91.4
 
Guinea-Bissau
26.3
1.4
 
94.7
 
27.2
2.2
 
91.9
 
Guyana
53.2
0.0
 
100.0
 
15.6
1.7
 
89.1
 
Haiti
169.0
2.3
 
98.6
 
197.7
3.7
 
98.1
 
Honduras
331.6
23.4
 
92.9
 
555.7
216.2
 
61.1
 
Iceland
195.1
0.0
 
100.0
 
2.6
 
2.2
 
15.4
 
India
6 681.0
216.5
 
96.8
 
15 026.9
 
2 904.9
 
80.7
 
Indonesia
8 332.7
0.0
 
100.0
 
5 787.4
 
299.9
 
94.8
 
Iran (Islamic Republic of)
4 571.7
240.6
 
94.7
 
8 572.9
 
508.6
 
94.1
 
Iraq
1 517.0
1 597.1
 
-5.3
 
1 580.6
8
1 752.4
 
-10.9
8
Israel
4 141.6
0.0
 
100.0
 
1 241.3
 
475.4
 
61.7
 
Jamaica
93.2
0.0
 
100.0
 
39.2
 
8.5
 
78.3
 
Japan
118 134.0
-0.7
3
100.0
 
2 466.8
 
1 050.0
 
57.4
 
Jordan
673.3
6.0
 
99.1
 
267.0
 
95.8
 
64.1
 
Kazakhstan
1 206.2
0.0
 
100.0
 
146.9
 
128.8
 
12.3
 
Kenya
239.5
7.5
 
96.9
 
322.0
 
75.7
 
76.5
 
Kiribati
0.7
0.0
 
100.0
 
0.0
 
0.2
 
-100.0
 
Korea, Dem. People's Rep.
441.7
33.5
 
92.4
 
2 326.3
 
91.2
 
96.1
 
Korea, Republic of
9 159.8
1 114.8
 
87.8
 
11 745.9
 
4 050.2
 
65.5
 
Kuwait
480.4
33.0
 
93.1
 
515.7
 
408.5
 
20.8
 
Kyrgyzstan
72.8
5.0
 
93.1
 
50.2
 
12.4
 
75.3
 
Lao People's Dem. Rep.
43.3
2.0
 
95.4
 
42.9
 
3.6
 
91.6
 
Lebanon
725.5
33.8
 
95.3
 
710.8
 
58.2
 
91.8
 
Lesotho
5.1
0.0
 
100.0
 
4.6
 
11.6
 
-152.2
 
Liberia
56.1
0.6
 
98.9
 
54.0
 
3.4
 
93.7
 
Libyan Arab Jamahiriya
716.7
21.9
 
96.9
 
1 596.5
 
111.6
 
93.0
 
Liechtenstein
37.2
0.0
 
100.0
 
0.1
 
0.0
 
100.0
 
Madagascar
47.9
0.8
 
98.3
 
8.8
 
3.0
 
65.9
 
Malawi
57.7
0.0
 
100.0
 
75.4
 
6.7
 
91.1
 
Malaysia
3 271.1
173.7
 
94.7
 
1 966.3
 
571.2
 
71.0
 
Maldives
4.6
0.0
 
100.0
 
4.0
 
3.7
 
7.5
 
Mali
108.1
3.0
 
97.2
 
28.3
 
5.1
 
82.0
 
Marshall Islands
1.1
0.0
 
100.0
 
0.3
 
0.2
 
33.3
 
Mauritania
15.7
1.0
 
93.6
 
16.5
 
6.5
 
60.6
 
Mauritius
29.1
0.0
 
100.0
 
14.4
 
6.9
 
52.1
 
Mexico
4 624.9
-130.4
3
102.8
 
3 954.7
 
1 992.3
 
49.6
 
Micronesia, Federated States of
1.2
0.0
 
100.0
 
2.2
 
0.2
 
90.9
 
Monaco
6.2
0.0
 
100.0
 
0.1
 
0.1
 
0.0
 
Mongolia
10.6
0.4
 
96.2
 
7.3
 
2.6
 
64.4
 
Montenegro
104.9
0.1
 
99.9
 
15.4
8
0.5
 
96.8
8
Morocco
802.3
0.0
 
100.0
 
1 070.0
 
212.7
 
80.1
 
Mozambique
18.2
2.3
 
87.4
 
14.4
 
4.9
 
66.0
 
Myanmar
54.3
0.0
 
100.0
 
45.7
 
2.0
 
95.6
 
Namibia
21.9
0.0
 
100.0
 
20.0
 
5.8
 
71.0
 
Nauru
0.5
0.0
 
100.0
 
0.0
 
...
2
...
 
Nepal
27.0
0.0
 
100.0
 
2.6
 
1.4
 
46.2
 
New Zealand
2 088.0
0.0
 
100.0
 
42.8
 
17.4
 
59.3
 
Nicaragua
82.8
0.0
 
100.0
 
64.9
 
3.9
 
94.0
 
Niger
32.0
2.9
 
90.9
 
27.6
 
3.1
 
88.8
 
Nigeria
3 650.0
16.5
 
99.5
 
3 933.3
 
312.7
 
92.0
 
Niue
0.1
0.0
 
100.0
 
0.0
5
0.0
 
0.0
5
Norway
1 313.0
-3.8
3
100.3
 
-42.8
3
15.6
 
136.4
 
Oman
248.4
8.5
 
96.6
 
201.5
 
33.2
 
83.5
 
Pakistan
1 679.4
167.4
 
90.0
 
2 347.2
 
356.9
 
84.8
 
Palau
1.6
0.1
 
93.8
 
0.2
 
0.1
 
50.0
 
Panama
384.1
11.5
 
97.0
 
204.7
 
40.2
 
80.4
 
Papua New Guinea
36.3
-1.6
3
104.4
 
39.7
 
1.5
 
96.2
 
Paraguay
210.6
27.3
 
87.0
 
105.5
 
39.0
 
63.0
 
Peru
289.5
0.0
 
100.0
 
203.6
 
28.0
 
86.2
 
Philippines
3 055.8
169.4
 
94.5
 
1 795.1
 
397.4
 
77.9
 
Qatar
101.4
5.1
 
95.0
 
105.4
 
43.8
 
58.4
 
Republic of Moldova
73.3
0.0
 
100.0
 
29.6
 
2.8
 
90.5
 
Russian Federation
100 352.0
324.0
 
99.7
 
892.3
 
1 457.6
 
-63.4
 
Rwanda
30.4
1.2
 
96.1
 
30.4
 
2.9
 
90.5
 
Saint Kitts and Nevis
3.7
0.0
 
100.0
 
6.3
 
0.4
 
93.7
 
Saint Lucia
8.3
0.0
 
100.0
 
7.7
 
0.1
 
98.7
 
Samoa
4.5
0.0
 
100.0
 
2.6
 
0.1
 
96.2
 
Sao Tome and Principe
4.7
0.2
 
95.7
 
4.4
 
0.2
 
95.5
 
Saudi Arabia
1 798.5
365.0
 
79.7
 
1 926.4
 
1 643.6
 
14.7
 
Senegal
155.8
10.0
 
93.6
 
82.3
 
19.5
 
76.3
 
Serbia
849.2
76.7
 
91.0
 
384.9
 
88.0
 
77.1
 
Seychelles
2.9
0.0
 
100.0
 
166.1
 
0.6
 
99.6
 
Sierra Leone
78.6
4.2
 
94.7
 
84.4
 
5.8
 
93.1
 
Singapore
2 718.2
0.0
 
100.0
 
146.7
 
149.5
 
-1.9
 
Solomon Islands
2.1
0.0
 
100.0
 
5.7
 
1.2
 
78.9
 
Somalia
241.4
20.0
 
91.7
 
124.1
 
28.3
 
77.2
 
South Africa
592.6
0.0
 
100.0
 
848.8
 
435.1
 
48.7
 
Sri Lanka
445.6
0.0
 
100.0
 
227.4
 
10.3
 
95.5
 
St. Vincent and the Grenadines
1.8
0.0
 
100.0
 
6.4
 
0.1
 
98.4
 
Sudan
456.8
44.8
 
90.2
 
258.2
 
91.9
 
64.4
 
Suriname
41.3
0.0
 
100.0
 
51.0
 
0.7
 
98.6
 
Swaziland
24.6
0.0
 
100.0
 
2.4
 
3.3
 
-37.5
 
Switzerland
7 960.0
0.0
 
100.0
 
26.2
 
10.0
 
61.8
 
Syrian Arab Republic
2 224.6
166.0
 
92.5
 
1 754.1
 
289.8
 
83.5
 
Tajikistan
211.0
0.0
 
100.0
 
12.6
 
3.9
 
69.0
 
Thailand
6 082.1
190.3
 
96.9
 
3 612.5
 
1 197.5
 
66.9
 
The Former Yugoslav Rep. of Macedonia
519.7
0.0
 
100.0
 
44.6
 
3.5
 
92.2
 
Timor-Leste
36.0
...
2
...
 
2.7
9
...
2
...
 
Togo
39.8
3.2
 
92.0
 
35.3
 
9.4
 
73.4
 
Tonga
1.3
0.0
 
100.0
 
1.0
 
0.2
 
80.0
 
Trinidad and Tobago
120.0
0.0
 
100.0
 
93.9
 
56.8
 
39.5
 
Tunisia
870.1
12.2
 
98.6
 
552.5
 
59.2
 
89.3
 
Turkey
3 805.7
-0.1
3
100.0
 
1 336.4
 
762.5
 
42.9
 
Turkmenistan
37.3
1.2
 
96.8
 
10.9
 
10.1
 
7.3
 
Tuvalu
0.3
0.0
 
100.0
 
0.0
 
0.0
 
0.0
 
Uganda
12.8
0.0
 
100.0
 
44.9
 
0.0
 
100.0
 
Ukraine
4 725.2
0.0
 
100.0
 
145.5
 
75.0
 
48.5
 
United Arab Emirates
529.3
52.9
 
90.0
 
624.2
 
560.7
 
10.2
 
United Rep. of Tanzania
253.9
13.9
 
94.5
 
71.5
 
15.4
 
78.5
 
United States
305 963.6
-569.2
3
100.2
 
16 206.4
 
6 229.6
 
61.6
 
Uruguay
199.1
26.4
 
86.7
 
100.9
 
53.9
 
46.6
 
Uzbekistan
1 779.2
0.0
 
100.0
 
0.8
 
2.3
 
-187.5
 
Vanuatu
0.0
0.7
 
-100.0
 
0.0
 
1.0
 
-100.0
 
Venezuela (Bolivarian Republic of)
3 322.4
-15.0
3
100.5
 
1 653.0
 
133.5
 
91.9
 
Viet Nam
500.0
20.4
 
95.9
 
447.4
 
277.5
 
38.0
 
Yemen
1 796.1
247.7
 
86.2
 
1 135.8
 
431.0
 
62.1
 
Zambia
27.4
2.0
 
92.7
 
24.0
 
6.9
 
71.3
 
Zimbabwe
451.4
7.0
 
98.4
 
345.8
 
37.3
 
89.2


Sources

UNSD Millennium Development Goals Database (http://mdgs.un.org/unsd/mdg/Default.aspx).

Footnotes:

  1. Refers to 2004 (or % change from 2004). Data for 2002 are unavailable.
  2. Data Not Reported and Party has no Obligation under the Montreal Protocol to Report data for that year at the time of publication of the data.
  3. Negative numbers will occur where exports plus destruction exceed actual production plus imports, e.g., if exports are from carry-over stock.
  4. Data from China from 1997 onwards include Hong Kong and Taiwan.
  5. Refers to 2003 (or % change from 2003). Data for 2002 are unavailable.
  6. Refers to 2005 (or % change from 2005). Data for 2002 are unavailable.
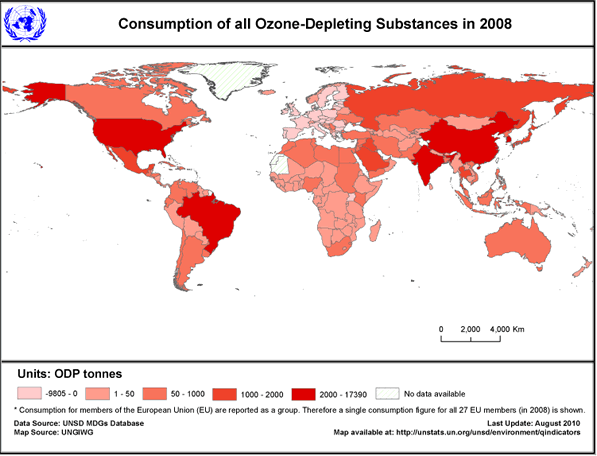
  7. Consumption for states that are members of the European Union is reported by the European Community. Therefore the individual member states do not report consumption data to the Ozone Secretariat. European Union (EU) consumption figures for the years before 1995 contain data reported for the 12 members at the time, namely Belgium, Denmark, France, Germany, Greece, Ireland, Italy, Luxembourg, Netherlands, Portugal, Spain and United Kingdom of Great Britain and Northern Ireland. Figures for1995-2003 represent the 15 members at the time, namely the previous 12 members plus Austria, Finland, and Sweden. Figures between 2004 and 2006 cover 25 members, namely the 15 members as of 1995 plus 10 members (Cyprus, Czech Republic, Estonia, Hungary, Latvia, Lithuania, Malta, Poland, Slovakia and Slovenia). Figures for the years starting 2007 onwards cover 27 members, namely the 25 members as of 2006 plus Bulgaria and Romania.
  8. Refers to 2006 (or % change from 2006). Data for 2002 are unavailable.
  9. Refers to 2007 (or % change from 2007). Data for 2002 are unavailable.


Definitions & Technical notes:

Ozone-depleting substances (ODS) are substances containing chlorine or bromine, which destroy the stratospheric ozone layer that absorbs most of the biologically damaging ultraviolet radiation. The phasing out of ODS, and their substitution by less harmful substances or new processes, are aimed at the recovery of the ozone layer. The indicators signify progress made towards meeting the commitments to phase out the use of ODS in countries which have ratified the 1987 Montreal Protocol on Substances that Deplete the Ozone Layer and its Amendments of London (1990), Copenhagen (1992), Montreal (1997) and Beijing (1999). Substances controlled by the Montreal Protocol are categorised into annexes, with different groups in each annex. These include chlorofluorocarbons (CFCs) (Annex A, group I), halons (Annex A, group II), methyl bromide (Annex E, group I) among others. In the table, All ODS refers to the aggregate consumption, in ODP tonnes, for the controlled substance categories that have data available.

The consumption data in this table are used to monitor the reduction in the usage of ODS as a result of the Montreal Protocol. Therefore only substances controlled under the Montreal Protocol are covered. Consumption data are calculated by the Ozone Secretariat using data reported in metric tonnes by the parties. Consumption is calculated as production plus imports minus exports, destroyed quantities, and feedstock uses of a controlled substance. Destruction and feedstock uses both take ODS out of the system (opposite of production), hence the reason for subtracting them when calculating consumption. The protocol also specifies that consumption shall not include the amounts used for quarantine and pre-shipment applications of methyl bromide, and further specifies that exports to non-Parties will count as consumption in the exporting Party.

The formula for calculating consumption is: consumption = total production - destroyed - production for internal feedstock use - production for internal quarantine use (for methyl bromide only) + total new imports - import for feedstock - import for quarantine use – total new exports + export to non-parties.

Reducing consumption ultimately leads to reductions in emissions since most uses of ODS finally lead to the substances being emitted into the atmosphere. The unit of measurement is metric tonnes of ODS weighted by their Ozone Depletion Potential (ODP), known as ODP tonnes. ODP refers to the amount of ozone depletion caused by a substance. It is the ratio of the impact on ozone of a chemical substance compared to the impact of a similar mass of CFC-11. The ODP of CFC-11 is defined to be 1. CFCs have ODPs that range from 0.6 to 1 while hydrochlorofluorocarbons (HCFCs) have ODPs that range from 0.001 to 0.52. The halons have ODPs of up to 10 while methyl bromide has an ODP of 0.6. ODP tonne equivalents are calculated by the Ozone Secretariat for each controlled substance.

Controlled substance means a substance in Annex A, Annex B, Annex C or Annex E of the Montreal Protocol, whether existing alone or in a mixture. It includes the isomers of any such substance, except as specified in the relevant Annex, but excludes any controlled substance or mixture that is in a manufactured product other than a container used for the transportation or storage of that substance. Therefore trade in finished products would not fall under the control of the protocol.

The baseline value for CFCs is calculated by the Ozone Secretariat for monitoring compliance in reducing consumption of ODS. The calculation of the baseline varies across parties and substance categories. In the case of CFCs, the baseline for developing countries (Article 5) is the average annual consumption from 1995 to 1998 and for developed countries (non-Article 5) the baseline is equivalent to the base year (1986).

The percentage reductions were calculated by UNSD. If the value was zero at baseline (for CFCs) or in 2002 (for all ODS) the percent change will be -100% for any positive value in the latest year. A value greater than 100% implies that the party's exports plus destruction exceed actual production plus imports (see footnote 3).

For a full list of the controlled substances as well as the control measures applicable to each group of substance, refer to the protocol text, which is available on the Ozone Secretariat's website at: http://ozone.unep.org/.

Data Quality:

Data reported to the Ozone Secretariat by the Montreal Protocol parties are collected using a variety of methods. These include registries or other collections from known producers and consumers, use of estimates and surveys, collecting information through (or from) customs, among other methods. National figures are used directly without adjustment. Currently, there is no validation by the Ozone Secretariat of the reported data. However, inconsistencies in the data are checked and rectified in consultation with the countries (e.g. reporting production for a specific use exceeding total production, or reporting abnormally high values compared to previous trends). Any missing values are left as non-reported in the Ozone Secretariat website (no attempts are made to estimate or impute values for missing years). For more information visit the Ozone Secretariat's website at: http://ozone.unep.org/.


United Nations Statistics Division - Environment Statistics