Sources:
UNSD/UNEP Questionnaires on Environment Statistics, Waste section.
Eurostat Environmental Data Centre on Waste (http://epp.eurostat.ec.europa.eu/portal/page/portal/waste/key_waste_streams/municipal_waste).
OECD Environmental Data Compendium, Waste section.
United Nations, Department of Economic and Social Affairs, Population Division, World Population Prospects: The 2008 Revision, New York, 2009 (advanced Excel tables).
Footnotes:
- Data refer to the amount of municipal waste generated.
- Data refer to total waste generation.
- Data refer to household waste generated.
- Data refer to municipal waste generated per capita.
- Data provided by Municipal Sanitation Services from the capital cities and El Alto; Sucre and Cobija are excluded.
- These are estimates based on household and marketplace surveys conducted in 1996 and 2004 in 13 regions of Burkina Faso. The estimates include only the urban population, since rural waste is dispersed in the environment and is usually combined with agricultural waste.
- Data refer to household waste only.
- Excluding construction waste, aluminium cans and metal-containing waste measured in cubic metres or other unit.
- Eurostat estimate.
- The information Includes the National District (Capital of the Republic) only, excluding the Santo Domingo Province.
- Total municipal solid waste generated in 299 Class-I cities.
- Refers to municipal waste collected in the 33 provincial capital cities only.
- Data refer to waste treated by municipalities and separate collection for recycling by the private sector.
- Data refer to urban population only.
- Unit: thousand cubic meters.
- Large increases in the amount of municipal waste collected between 2008 and 2009 are a result of changes made in reporting of municipal service activity, particulary an enlarged scope of data collection. Also, in 2009 municipal waste collection authorities began work in additional settlements not covered previously.
- Data include landfilled household waste and recycled packaging waste.
- Data refer to solid waste reaching dumping site which was taken from the Dumping Site Survey implemented in 2001.
- Data refer to percentage of total population served by waste collection only by Local Authority.
- Municipal waste from the Panamá and San Miguelito districts.
- 2009 excluding Azores and Madeira (2.5% of total population).
- Data refer to the solid waste from households and liquid waste transported by different types of specialized vehicles from urban areas. Units of measure - thou. m³.
- Includes liquid waste from sewage trucks.
- The quantities of waste collected by municipal services cover only a few years and are available only for the urban community of Dakar.
- Municipal waste includes industrial waste from manufacturing industries.
- The data include only Khartoum state. Khartoum state cleaning project commeced work in 2002.
- The figures cover the capital city (district Paramaribo) and the second largest district of Wanica.
- Data are collected through the regular annual survey on municipal waste for the reference year 2008 for the first time.The source of data are municipal enterprises that collected municipal waste. For areas not covered by a municipal waste collection system, the amount of waste generated is estimated. The methodology is fully compiled with EU Regulation 2150/2002.
- Data are from Trinidad and Tobago Solid Waste Management Company Limited (SWMCOL). The landfills managed by SWMCOL collect 85% of solid waste.
- Number may be underestimated due to incompleteness of the data collection. Data cover only separated solid domestic wastes.
- Data have been collected from the following sources: 1. Abu Dhabi Centre for Waste Management, 2. Municipality of Dubai, 3. Municipality of Sharjah, 4. Municipality of Umm al Qaiwain, 5. Municipality of Ajman, 6. Municipality of Fujairah, and 7. Ras al Khaimah Public Works and Services Department.
- The quantity of municipal waste collected is about 40% of the total annual municipal waste generated in the Republic.
- Estimated percentage (equals to two third of the urban population to total resident population).
Definitions & Technical notes:
Municipal waste, collected by or on behalf of municipalities, by public or private enterprises, includes waste originating from: households, commerce and trade, small businesses, office buildings and institutions (schools, hospitals, government buildings). It also includes bulky waste (e.g., white goods, old furniture, mattresses) and waste from selected municipal services, e.g., waste from park and garden maintenance, waste from street cleaning services (street sweepings, the content of litter containers, market cleansing waste), if managed as waste. The definition excludes waste from municipal sewage network and treatment, municipal construction and demolition waste.
Municipal waste collected refers to waste collected by or on behalf of municipalities, as well as municipal waste collected by the private sector. It includes mixed waste, and fractions collected separately for recovery operations (through door-to-door collection and/or through voluntary deposits).
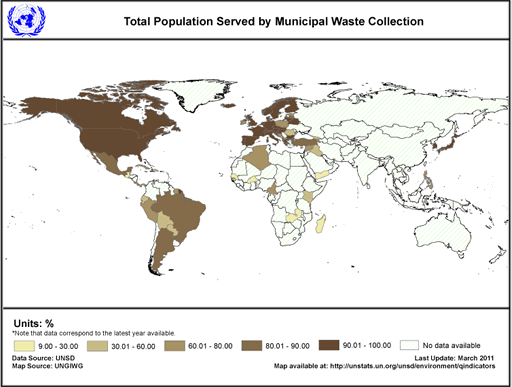
Total population served by municipal waste collection is the proportion of the total population covered by regular municipal waste removal service in relation to the total population of the country.
For non-EU countries, municipal waste collected per capita served is calculated by UNSD by dividing the municipal waste collected by the number of people served by the waste collection system. For EU countries, data for municipal waste collected per capita are from Eurostat Environmental Data Center on Waste.
Data Quality:
Data on municipal waste collected are usually gathered through surveys of municipalities, which are responsible for waste collection and disposal, or from transport companies that collect waste and transport it to a disposal site. Such surveys deliver fairly reliable data. However, the figures only cover waste collected by or on behalf of municipalities. Therefore:
- Amounts of waste will vary, depending on the extent that municipal waste collection covers small industries and the services sector.
- Waste collected by the informal sector, waste generated in areas not covered by the municipal waste collection system or illegally dumped waste are not included.
Caution is therefore advised when comparing countries.
|